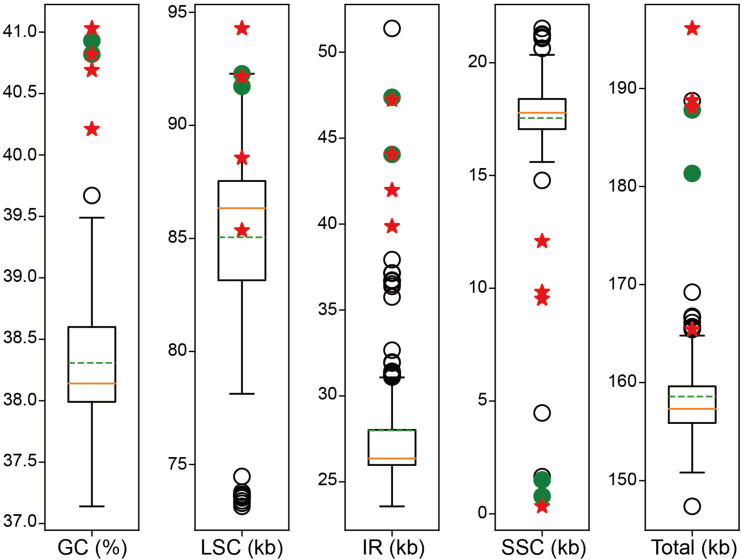
FIGURE 2.
Boxplot distribution of GC content, LSC size, IR size, SSC size, and total genome size of the Corydalis plastomes relative to Ranunculales. The orange solid lines indicate the median. The green dotted lines indicate the mean value. The red five-pointed stars indicate the newly sequenced Corydalis plastomes. The green solid circles indicate previously published Corydalis plastomes. Empty circles indicate the rest outliers.

