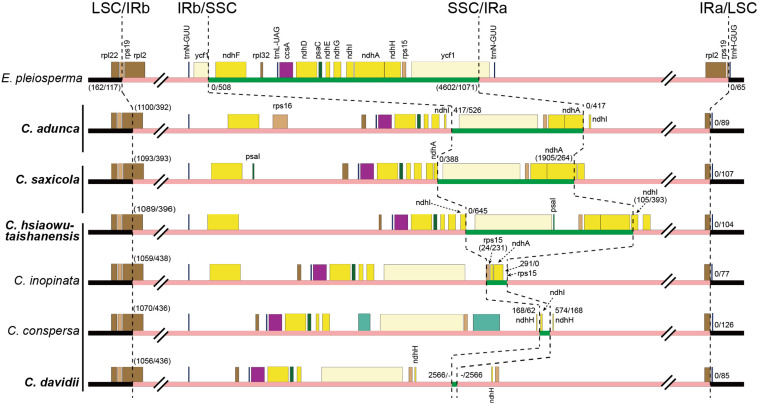
FIGURE 4.
Comparison of LSC, IR, and SSC boundaries among Corydalis and E. pleiosperma plastomes. The black, pink, and green thick lines indicate LSC, IR, and SSC, respectively. The numbers before and after the slash indicate the distance of the nearest genes relative to the junction site or the length of the front and latter parts of the genes that span the junction site when they appeared within a parenthesis. The vertical lines after species names, from top to bottom, indicate subg. Cremnocapnos, subg. Sophorocapnos, and subg. Corydalis, respectively. Species in bold are newly sequenced.

