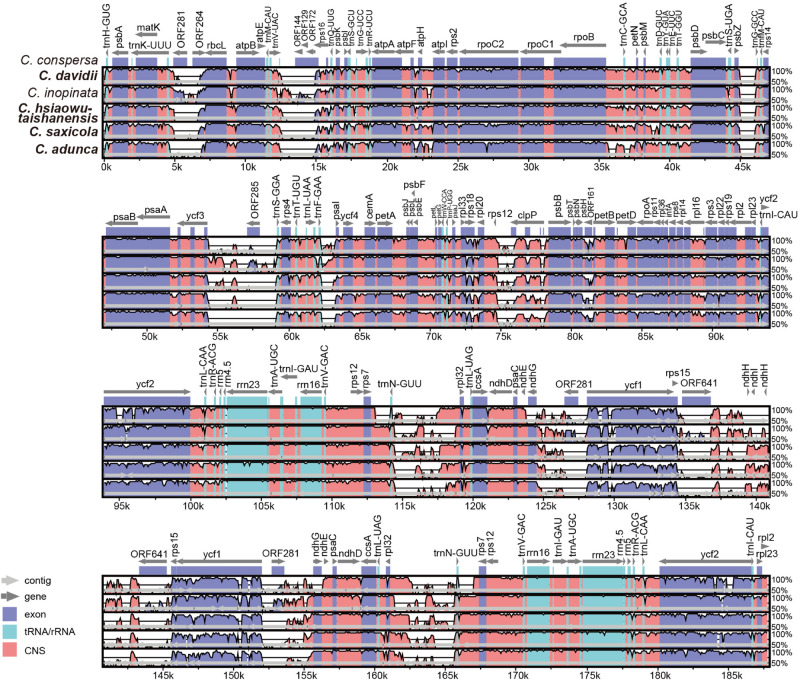
FIGURE 5.
Comparative analyses of plastome differences in the four Corydalis plastomes. The dark blue regions represent exons, light-blue regions represent untranslated regions (tRNA and rRNA), and pink regions represent non-coding sequences (CNS). The vertical scale shows the percentage of identity, varying from 50 to 100%. Species in bold are newly sequenced.

