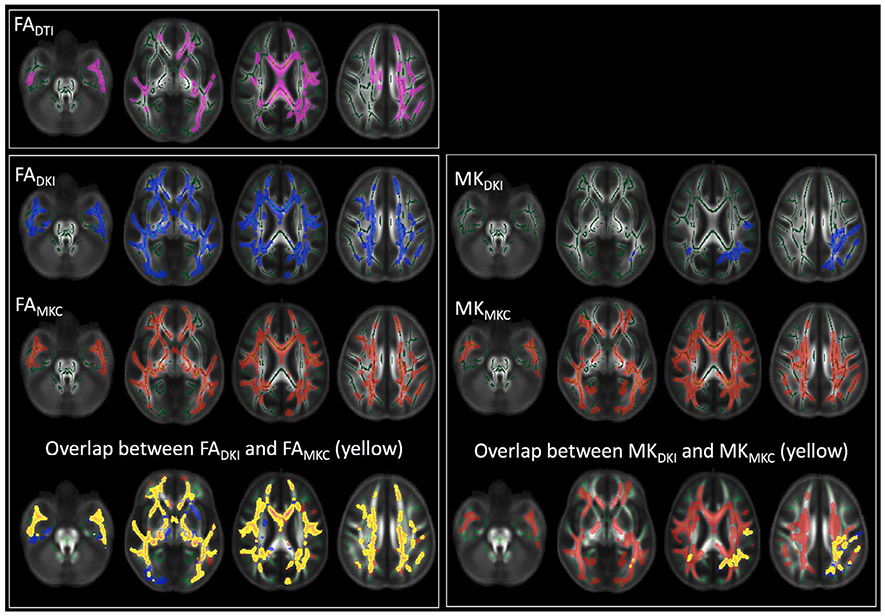
Fig. 5.
All parameters had significantly lower values in CHR compared with HC. The number of significant voxels was higher for the MK-curve corrected values (FAMKC and MKMKC ). While location of significant voxels highly overlapped across the FA measures, the MKMKC measure had many more voxels identified as lower in the CHR group than the MKDKI measure.

