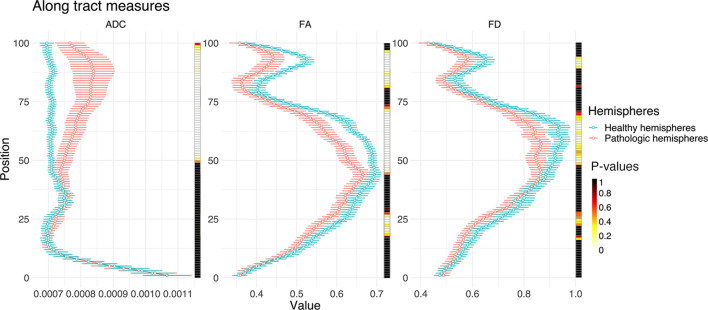
Figure 5.
Line plots illustrating ADC, FA, and FD along the entire CST of both hemispheres (0, medulla oblongata; 100, cortex). The points indicate median values with their respective 95% confidence intervals. The heat-maps demonstrate related Bonferroni-corrected p-values, derived by paired t-tests.

