Figure 6.

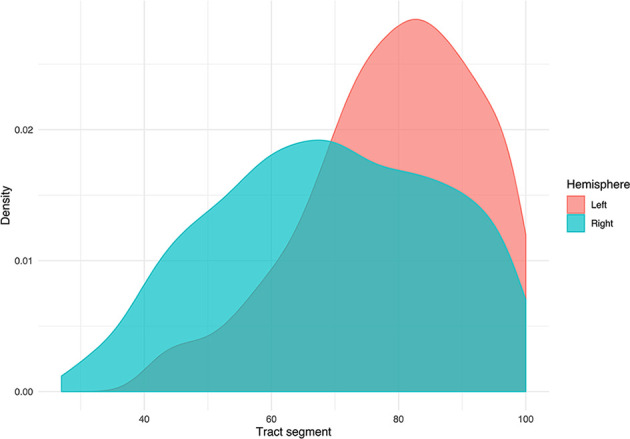
Density plot displaying the distribution of tumors grouped by hemispheric occurrence. Additionally, the plot shows that no tumors occur below segment 25.

Density plot displaying the distribution of tumors grouped by hemispheric occurrence. Additionally, the plot shows that no tumors occur below segment 25.