
Table 2.
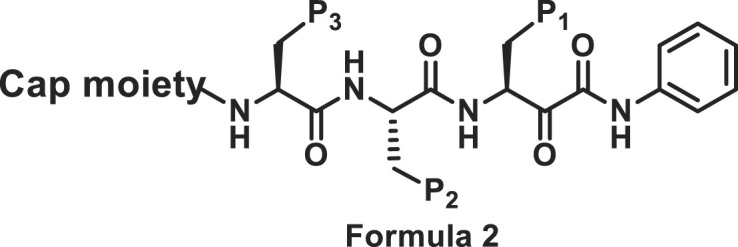
The cell-based CT-L inhibitory activity of P1, P2 and P3 modified compounds.
| Compound | Cap moiety | P1 | P2 | P3 | CT-La IC50 (nM) |
|---|---|---|---|---|---|
| 17 (NI-01069) |  |
Ph | (4-CH3O)-Ph | H | 364.6 ± 42.2 |
| 18 (NI-04104) |  |
i-Pr | (4-CH3O)-Ph | H | 418.9 ± 82.0 |
| 19 (NI-01099) |  |
i-Pr | (4-CH3O)-Ph | H | 1026 ± 235.4 |
| 27 (NI-07028) |  |
i-Pr | 1H-indol-3-yl | H | 155.7 ± 25.9 |
| 28 (NI-06032) |  |
i-Pr | Ph | H | 2008 ± 219.7 |
| 29 (NI-07021) |  |
i-Pr | 1H-indol-3-yl | i-Pr | 66.5 ± 11.0 |
| 30 (NI-04162) |  |
i-Pr | Ph | i-Pr | 230.8 ± 14.5 |
| 31 (NI-18088) |  |
i-Pr | Ph | Cyclohexyl | 603.3 ± 26.7 |
| 32 (NI-18143) |  |
i-Pr | Ph | CH3O | 243.4 ± 32.8 |
| BSc2189 |  |
i-Pr | i-Pr | i-Pr | 34.5 ± 1.7 |
| ONX-0914 | 58.5 ± 4.3 |
a
The compounds were assayed in triplicate with the averaged IC50 ± SEM values shown.