Table 3.
The cell-based CT-L inhibitory activity of head group modified compounds.
| Compound | Cap moiety | P2 | P3 | Head group | CT-La IC50 (nM) |
|---|---|---|---|---|---|
| 33 (NI-01106) |  |
(4-CH3O)-Ph | H | 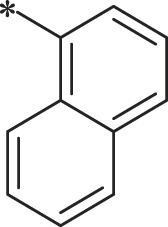 |
385.6 ± 36.9 |
| 34 (NI-04192) |  |
Ph | i-Pr | 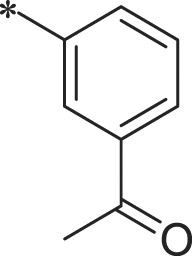 |
61.0 ± 3.1 |
| 35 (NI-09016) |  |
1H-indol-3-yl | i-Pr | 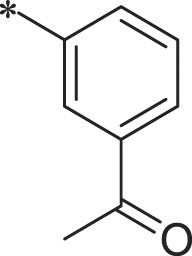 |
29.5 ± 3.1 |
| 36 (NI-18030) |  |
1H-indol-3-yl | i-Pr | 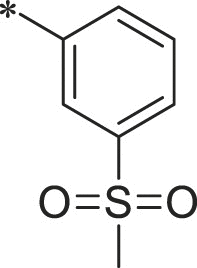 |
60.1 ± 10.0 |
| 37 (NI-09062) |  |
1H-indol-3-yl | i-Pr | 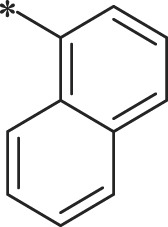 |
165.1 ± 7.6 |
| 38 (NI-23067) |  |
i-Pr | i-Pr | 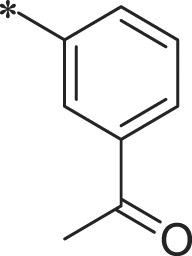 |
22.1 ± 1.2 |
| 39 (NI-18019) |  |
i-Pr | i-Pr | 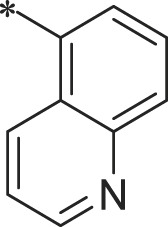 |
99.7 ± 24.7 |
| 40 (NI-18020) |  |
i-Pr | i-Pr | 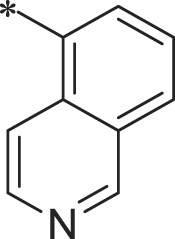 |
64.1 ± 16.6 |
| 41 (NI-09073) |  |
i-Pr | i-Pr |  |
4701 ± 961 |
| 42 (NI-18073) |  |
i-Pr | i-Pr | 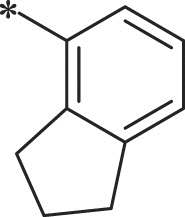 |
41.7 ± 2.5 |
| 43 (NI-18060) |  |
i-Pr | i-Pr | 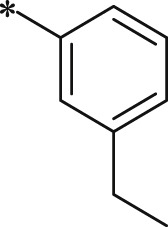 |
34.8 ± 2.6 |
| 44 (NI-09083) |  |
i-Pr | i-Pr |  |
25.7 ± 3.1 |
| 45 (NI-18050) |  |
i-Pr | i-Pr |  |
31.7 ± 4.9 |
| 46 (NI-15020) |  |
i-Pr | i-Pr | 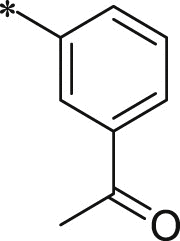 |
25.3 ± 3.8 |
| 47 (NI-18145) |  |
i-Pr | i-Pr | 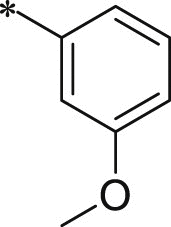 |
28.8 ± 3.4 |
| BSc2189 |  |
i-Pr | i-Pr | 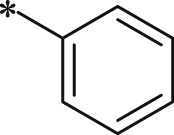 |
34.5 ± 1.7 |
| ONX-0914 | 58.5 ± 4.3 |
The compounds were assayed in triplicate with the averaged IC50 ± SEM values shown.

