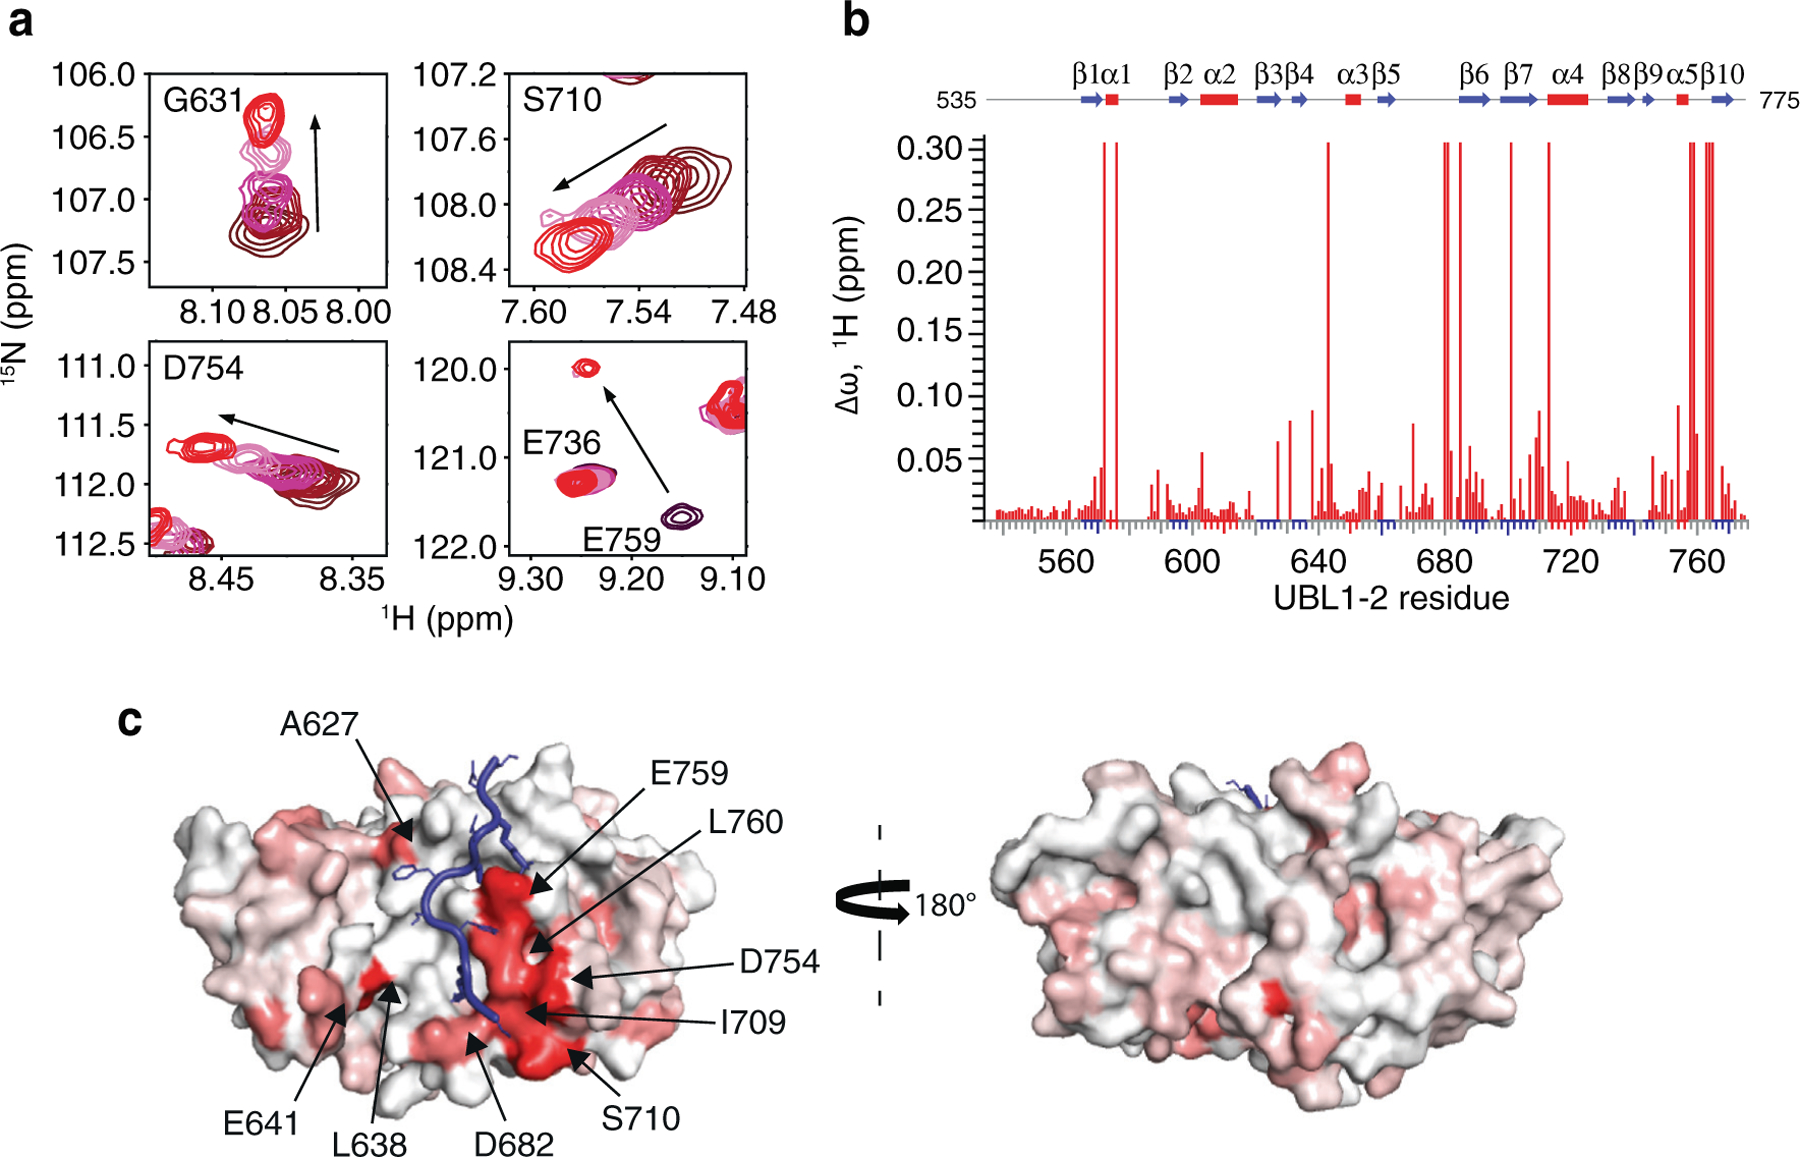
Figure 7.

Pol ι binds to a crevice on the surface of USP7 UBL1-2. (a) Select residues of USP7 UBL1-2 domains that demonstrate CSPs when titrated with increasing amounts of Pol ι peptide 438–448 (1:5 protein:peptide molar ratio). (b) Per-residue CSPs (Δω) are quantified and represented as bar plots. Residues that were only observed in “free” or “bound” states due to peak broadening were assigned to the highest observed CSP value. (c) HADDOCK model of the USP7 UBL1-2 domains and Pol ι peptide 438–448 complex. CSPs from NMR experiments were used to map the binding interface, shown in red.
