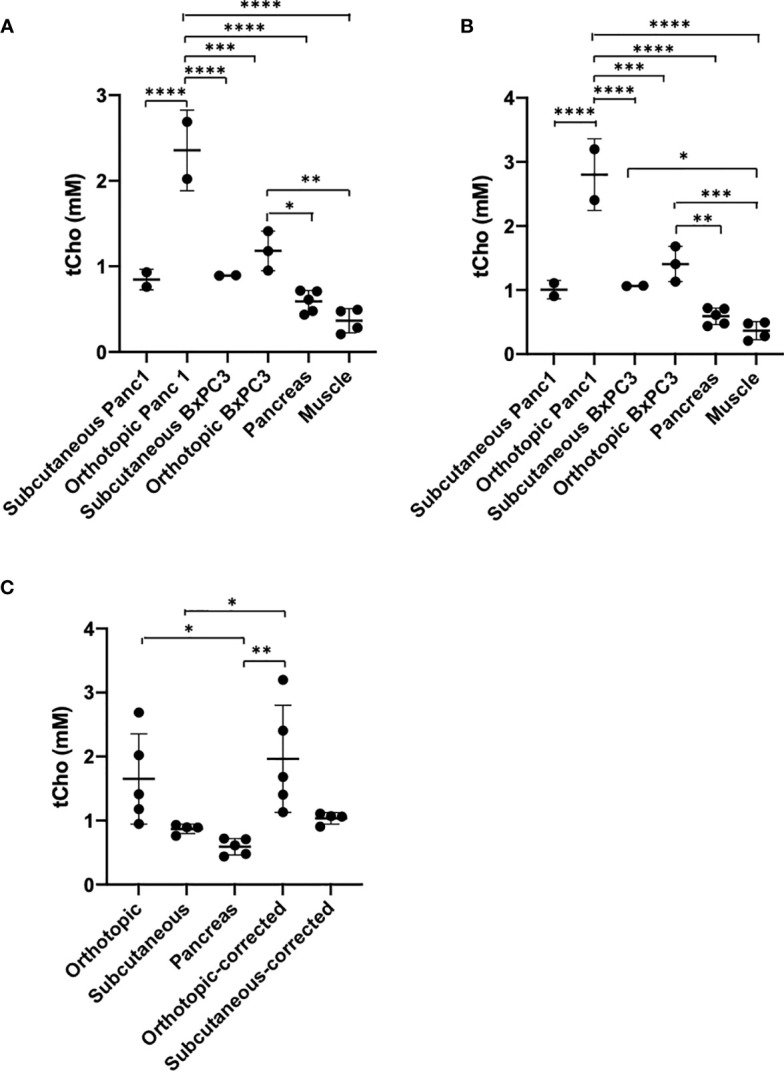
Figure 3.

(A) tCho concentration quantification from the ex vivo 4 mm thick 1H MRSI maps without correction. Pancreas n=5, Muscle n=4, Panc1 tumors n=4 (orthotopic n=2, subcutaneous n=2), BxPC3 tumors n=5 (orthotopic n=3, subcutaneous n=2). (B) tCho concentration quantification from the ex vivo 4 mm thick 1H MRSI maps after correction. (C) tCho concentration in both subcutaneous and orthotopic tumor types averaged before and after correction (subcutaneous tumors: n=4; orthotopic tumors and pancreas: n=5). Values represent Mean +/− SD. One-way ANOVA P<0.0001 (A, B) P < 0.004 (C). Dunnett’s multiple comparison test: *p < 0.05, **p < 0.01, ***p < 0.001, ****p < 0.0001.
