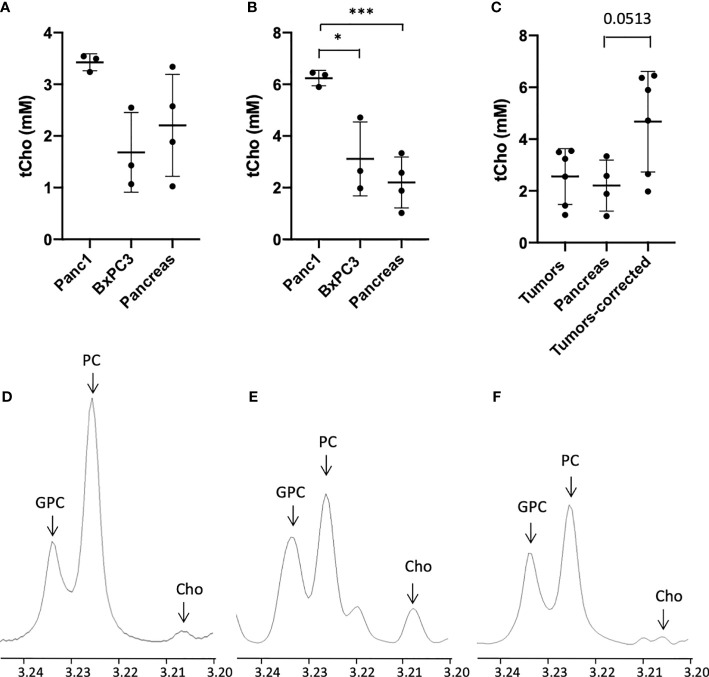
Figure 4.
tCho concentrations in mM derived from the water phase of Panc1, and BxPC3 orthotopic tumor extracts with high-resolution 1H MRS (tCho=Cho+PC+GPC) compared to normal adjacent pancreas before (A) and after (B) water content correction, (n=3). (C) tCho concentrations in mM averaged for the orthotopic tumors before and after correction as compared to normal pancreas (n=12). Representative 1H MR spectra of orthotopic Panc1 tumor (D), orthotopic BxPC3 tumor (E) and normal pancreas (F) (x-axis, chemical shift in ppm). Values represent Mean +/- SD. One-way ANOVA P = 0.06 (A) P < 0.004 (B) P < 0.04 (C) Dunnett’s multiple comparison test: *p < 0.05, ***p < 0.005.

