Figure 5.
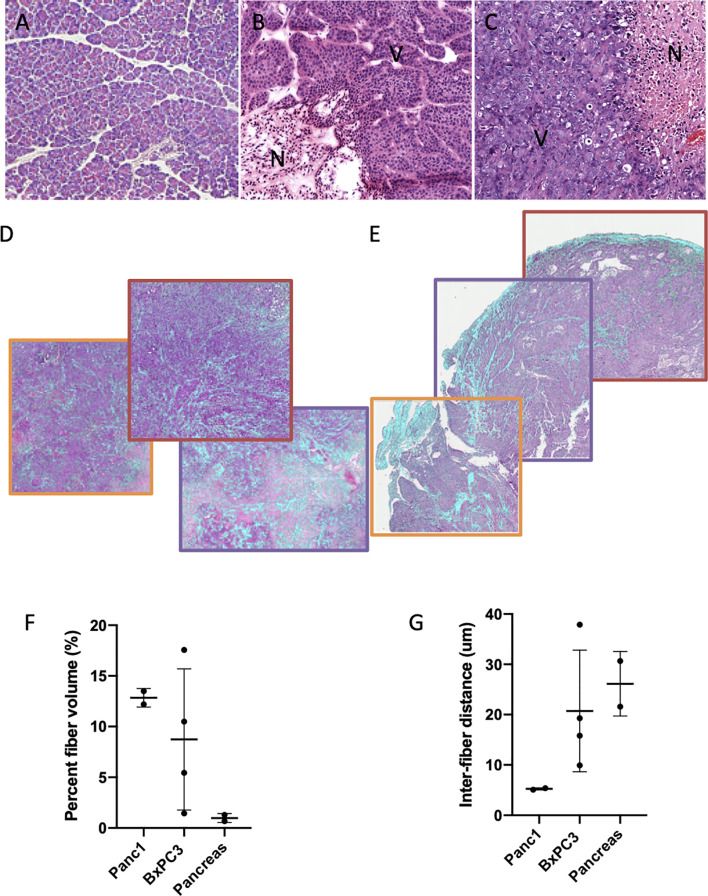
H&E-stained sections of normal pancreas (A), orthotopic BxPC3 tumor (B), orthotopic Panc1 (C). (N-necrotic area, V-viable tissue). Second harmonic generation (SHG) images overlaid with H&E-stained sections of orthotopic BxPC3 tumor (D), orthotopic Panc1 tumor (E) in three different fields of view. Quantification of fiber volume (F) and inter fiber distance (G) in normal pancreas, orthotopic BxPC3 tumor, and orthotopic Panc1 tumor. Values represent Mean +/- SD.

