Fig. 4.
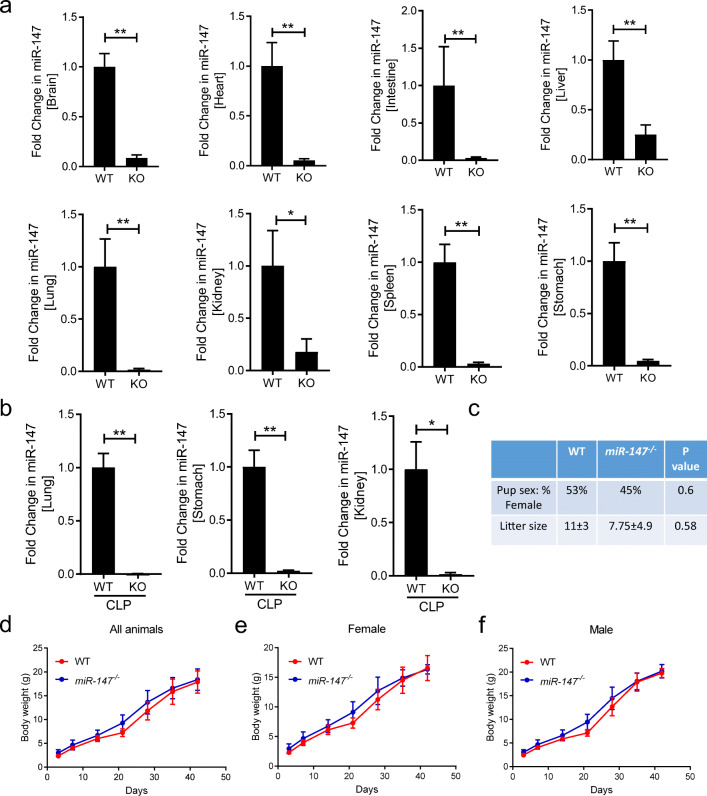
Confirmation of miR-147 KO in various tissues and breeding characteristics and growth curve of miR-147−/− (KO) mice. a Basal transcript level of miR-147 in the brain, heart, intestine, liver, lung, kidney, spleen, and stomach from C57BL/6J (WT) and miR-147−/− mice (KO) (n = 6/group). b Transcript level of miR-147 in the lung, stomach, and kidney from WT and miR-147−/− mice following CLP procedure (n = 6 for WT; n = 5 for KO mice). c Comparison of gender ratio and average litter size from WT and KO mice that were used for the present study. P value from Fisher’s exact test and unpaired t test, respectively. d Growth curve based on body weight of all animals from WT and KO mice over 42 days. e Growth curve based on body weight of females from WT and KO mice. f Growth curve based on body weight of males from WT and KO mice. Graphs for mRNA expression represent mean ± SEM and growth curves represent mean ± SD. *P < 0.05, **P < 0.01 relative to WT, by Mann-Whitney test.

