
Figure 5. Immunohistochemistry (IHC) staining of the livers from CD-1 mice without (solid columns) or with (stripe columns) macrophage depletion 24 h and 72 h after treatment with NPs and their small molecule counterparts.
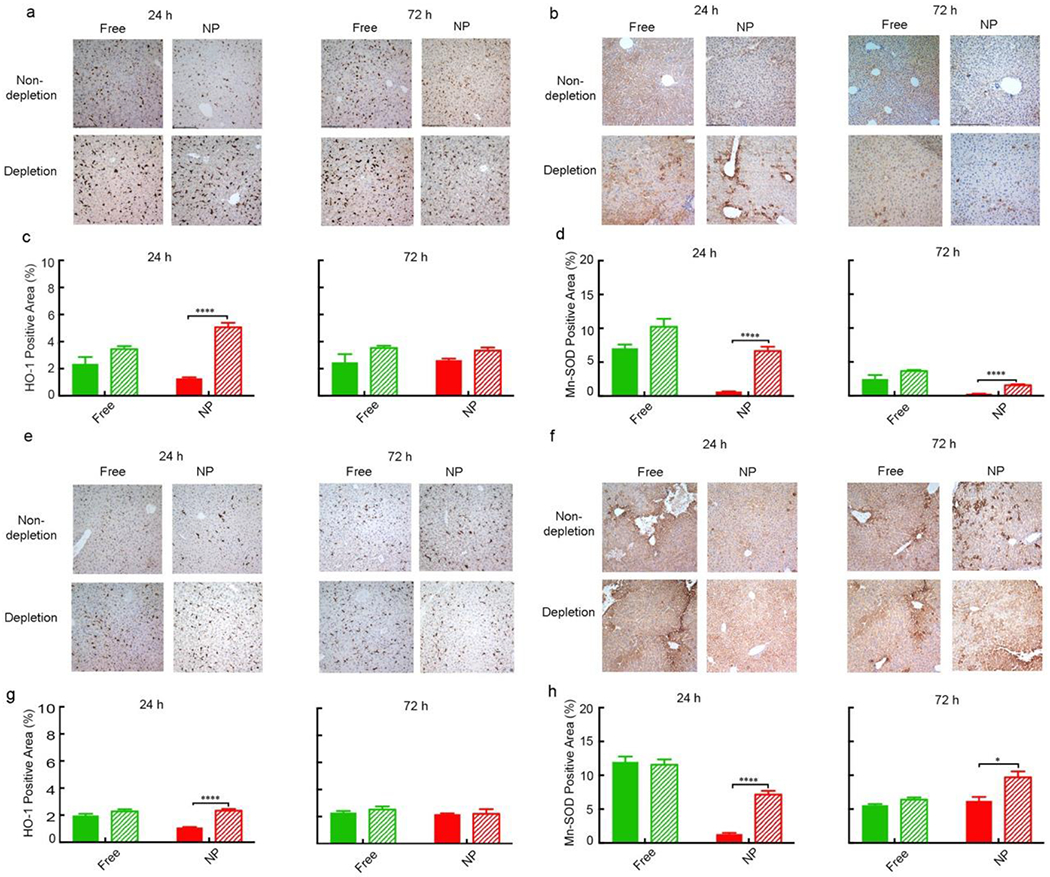
a, HO-1 staining of the livers treated with free CPZ and CPZ-loaded NP. b, Mn-SOD staining of the livers treated with free CPZ and CPZ-loaded NP. c, d, Quantitative analysis of positive staining percentage in (a) and (b), respectively. Scale bar= 480 μm. Data represent mean ± SEM (n = 5). Statistical significance was assessed using the Mann Whitney test. *p < 0.05, **p < 0.01, ***p < 0.001, ****p < 0.0001. e, HO-1 staining of the livers treated with free Wtmn and Wtmn-loaded NPs. f, Mn-SOD staining of the livers treated with free Wtmn and Wtmn-loaded NPs. g, h, Quantitative analysis of positive staining percentage in (e) and (f), respectively. Scale bar= 480 μm. Data represent mean ± SEM (n = 5). Statistical significance was assessed using the Mann Whitney test. *p < 0.05, **p < 0.01, ***p < 0.001.