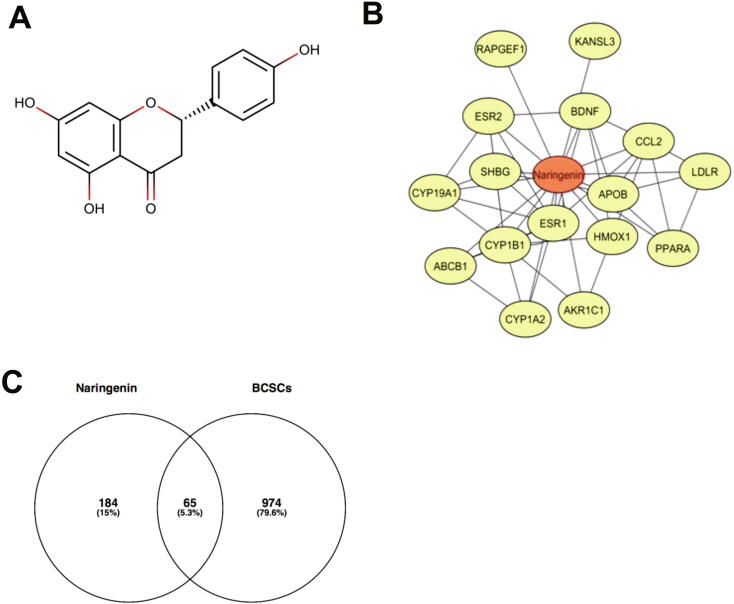
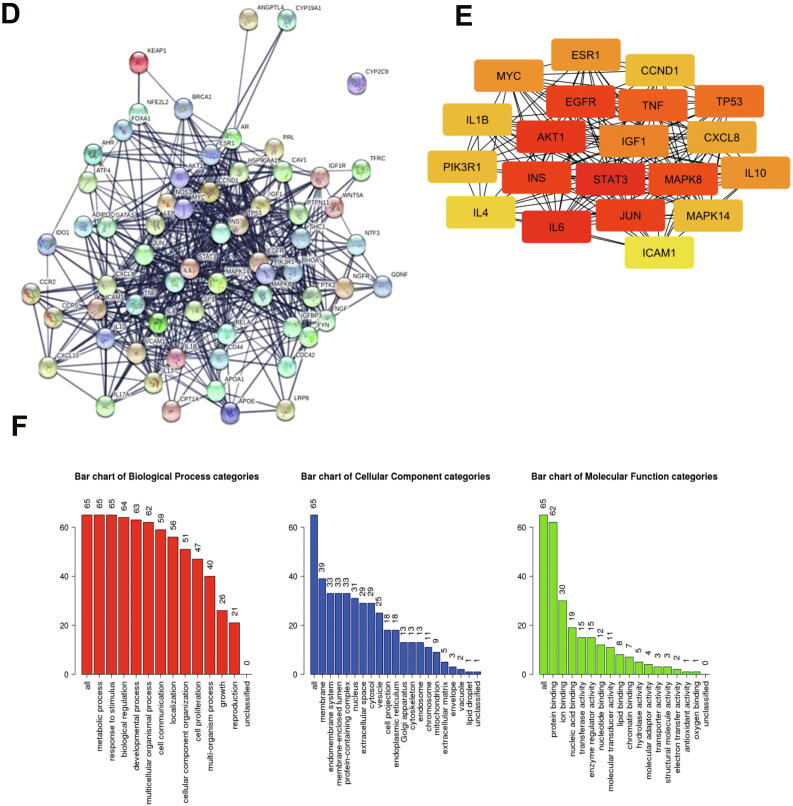
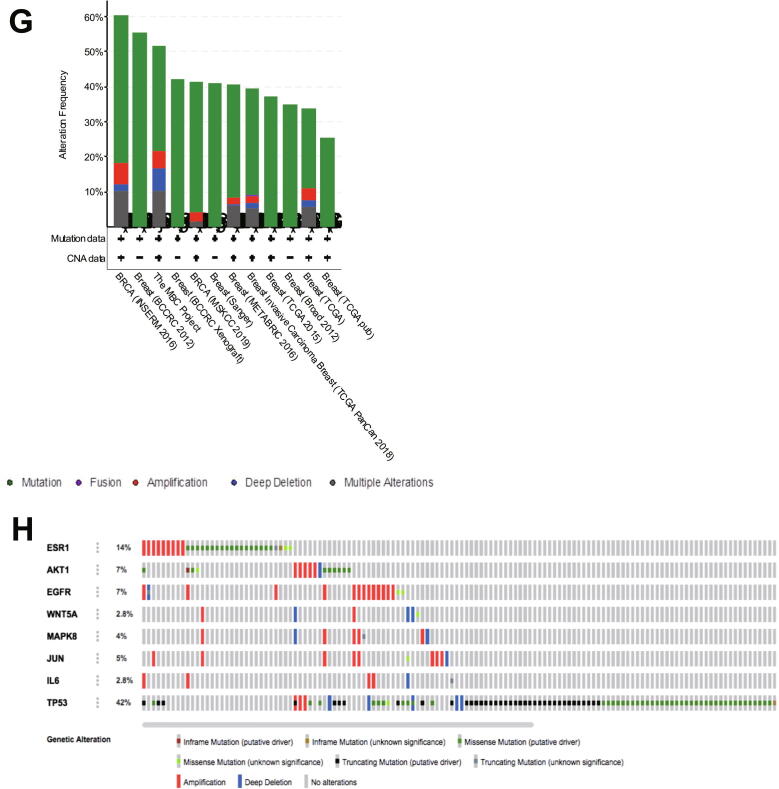
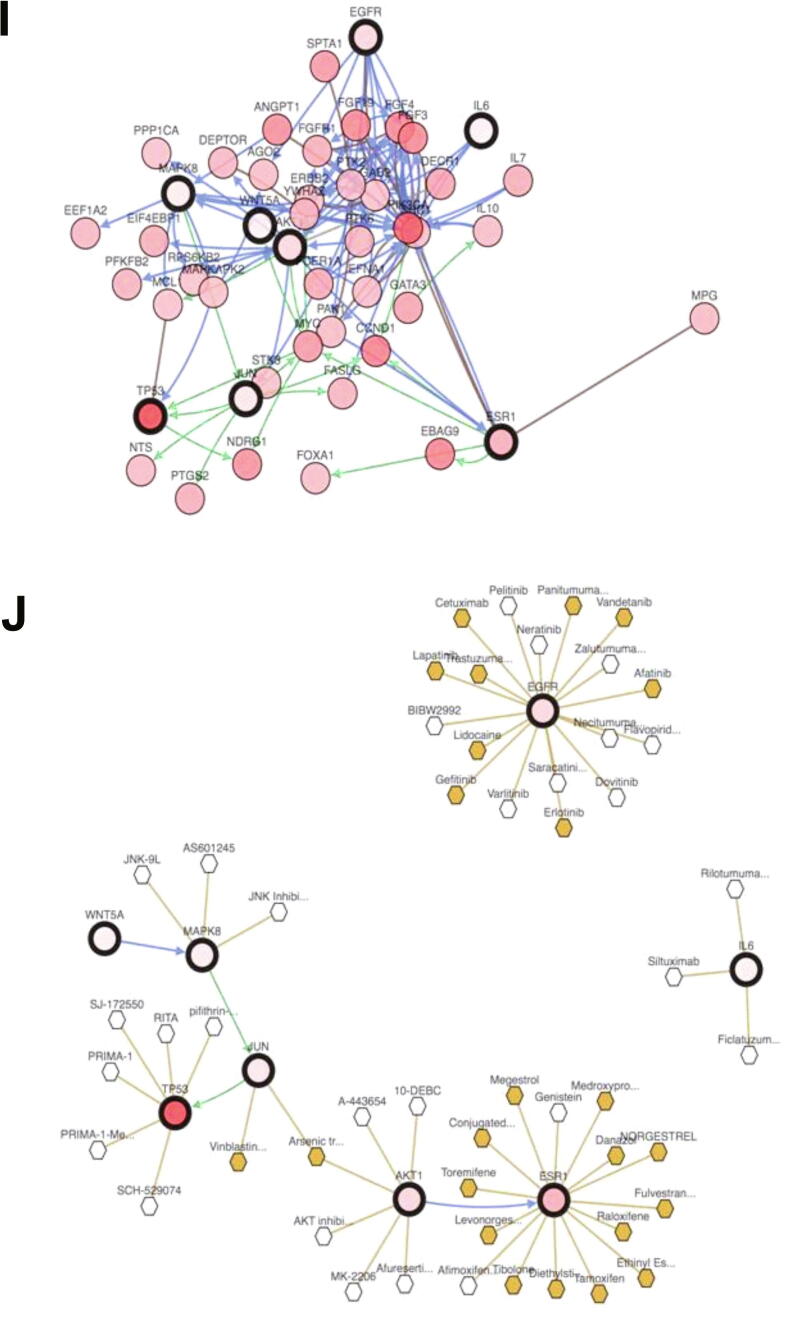
Fig. 1.
(A). The structure of naringenin. (B). Interactions of naringenin and its DTPs. (C). A Venn diagram of PTT related to Naringenin and BCSCs. (C). PPI network of naringenin protein targets, analyzed using STRING. (D). Top 10 hub proteins based on degree score, analyzed by CytoScape. (E). GO enrichment of PTTNs, analyzed by WebGestalt. (F). Overview of changes in PRKCA, EGFR, ERBB4, AREG, ESR1, and STAT1 in genomics dataset from 16 studies of breast cancer. (G). Summary alterations of ESR1, AKT1, EGFR, WNT5A, MAPK8, JUN, IL6, and TP53 across breast cancer samples (based on a study by Levebvre et al., 2016). (H). Gene network and (I). Drug-gene network connected to ESR1, AKT1, EGFR, WNT5A, MAPK8, JUN, IL6, and TP53 in breast cancer samples (based on a study by Lefebvre et al., 2016).


