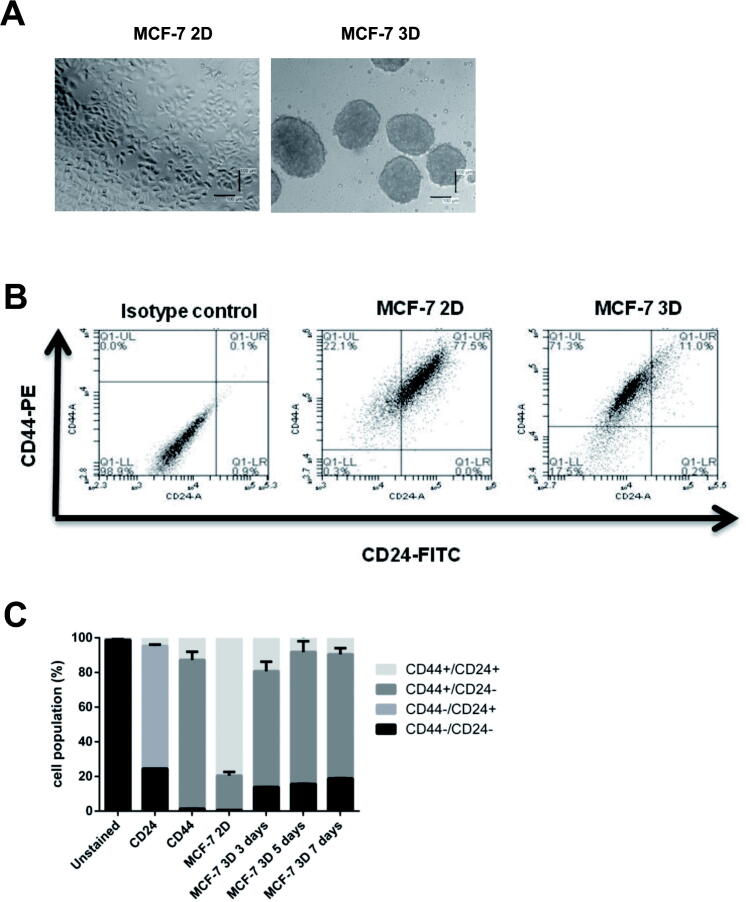
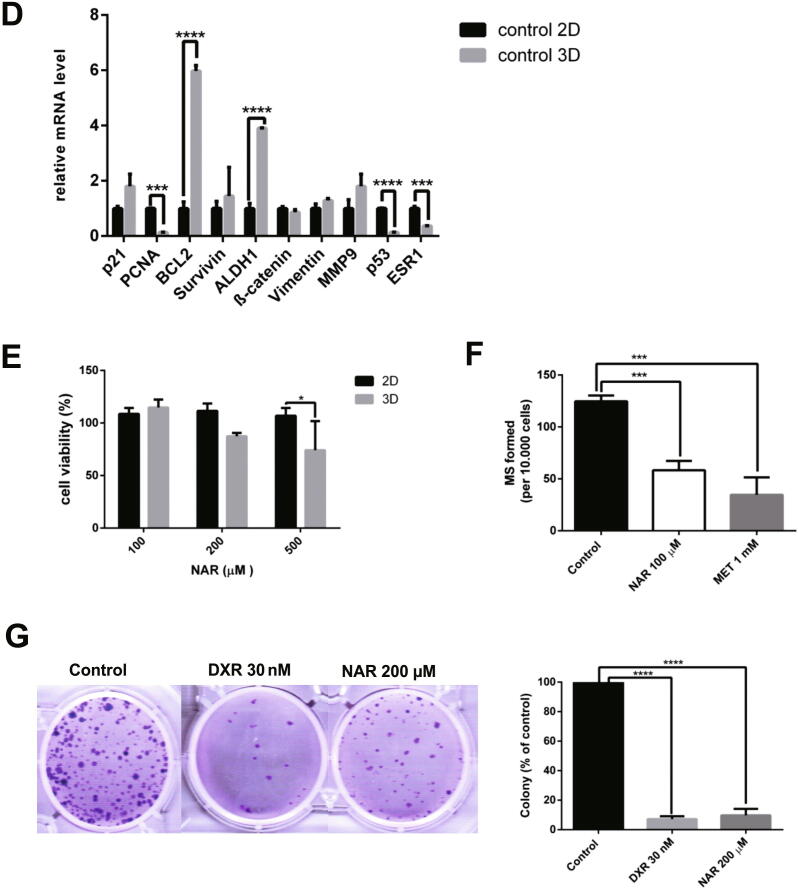
Fig. 2.
(A). Generation of mammospheres from MCF-7 cells. Formation of mammospheres from MCF-7 cells in serum-free media, as described in the methods section. Cells were seeded in a poly HEMA-coated plate (B). Identification of CD44+/CD24− population in MCF-7 cells using flow cytometry. (C). Quantification of CD44+/CD24− population in MCF-7 cells using flow cytometry. Cells in Q1-UL corresponded to CD44+/CD24− cells. An isotype control of MCF-7 cells (2D) was shown. (D). Gene expression of apoptosis, cell cycle, EMT, and stemness markers in 2D and 3D cells. Gene expression was determined by q-RT PCR. GAPDH was used as an internal control. The results were analyzed using the comparative threshold cycle (ΔΔCT) and are presented as fold change to the 2D cells. (E). Cytotoxicity of naringenin in MCF-7 cell monolayer (2D) and mammospheres (3D). A total of 10,000 cells per well were seeded in 96-well plates, as described in the method section. Cells were treated with naringenin and incubated for 72 h. MTT assay is used to determine cell viability. (F). Naringenin inhibits mammosphere formation from MCF-7 cells. Cells were seeded in 6-well plates and then incubated to 80% confluence. Subsequently, cells were treated with samples for 72 h. After that, the media was replaced with new media, and the cells were incubated for a further 24 h. Furthermore, 10,000 cells per well were seeded in 96-well plates and incubated for five days. At the end of incubation, the number of mammospheres formed is then calculated manually and analyzed as MFP. (G). Naringenin inhibits colony formation in MCF-7 cells. Naringenin treatment was given at 500 cells/well for 72 h, then the culture medium was replaced, and cells were grown for 14 days and stained at the end of the incubation period using gentian violet. The number of colonies was quantified with ColonyArea. Results represent the average of three independent experiments (mean ± SD). Two-way ANOVA with post-hoc Bonferroni’s multiple comparisons test was used to analyze the CD44+/CD24− population enrichment assay and cytotoxic effect of naringenin, while one-way ANOVA with post-hoc Bonferroni’s multiple comparisons test was used to analyze the effect of naringenin on mammosphere and colony formation. *** or **** indicates p < 0.001 or p < 0.0001, respectively. In Fig. 2C **** indicates significant to MCF-7 2D (p < 0.0001), while ++ in indicates significant to day 3 (p < 0.01).


