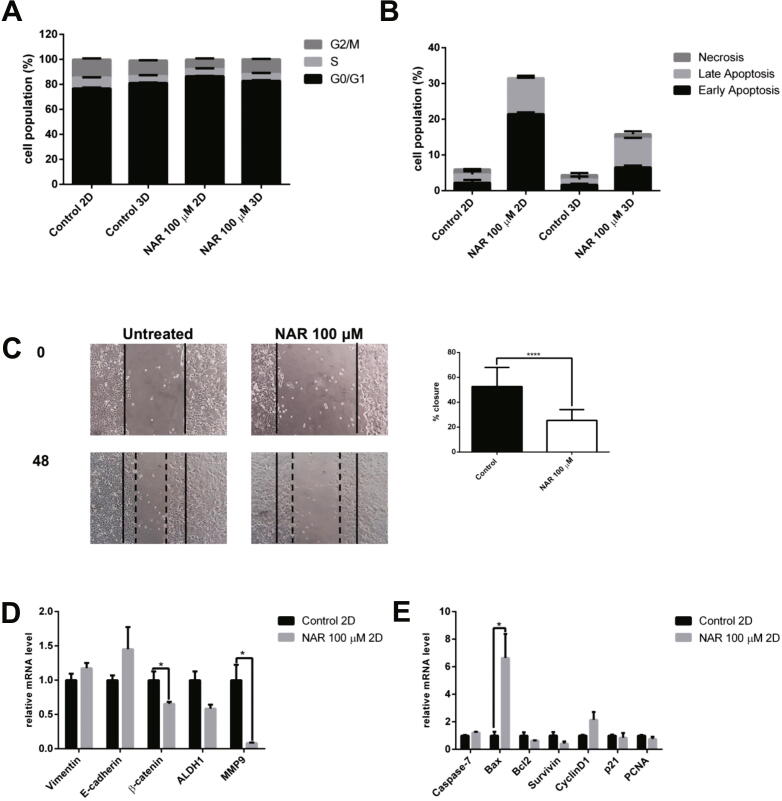
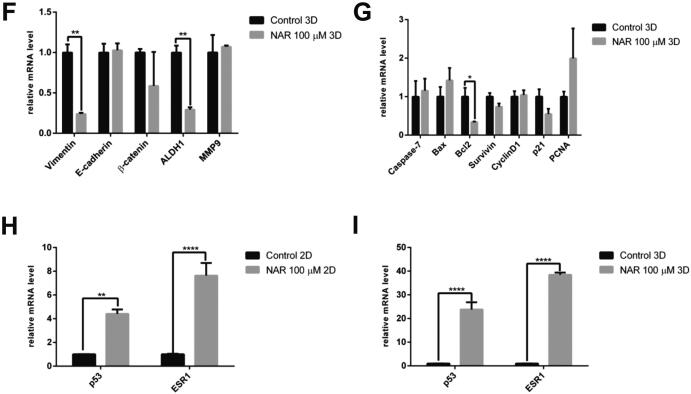
Fig. 3.
The effect of naringenin on the (A). Cell cycle profile. Cells were harvested after naringenin treatment for 72 h, stained with propidium iodide reagents, before analysis of DNA content using flow cytometry. (B). Apoptosis induction. Cells were harvested after naringenin treatment for 120 h, stained with annexin V and propidium iodide reagents, incubated, and analyzed using flow cytometry. The total percentage of cells consists of living cells, and cells undergoing early apoptosis, late apoptosis, and necrosis. (C). Naringenin inhibits migration. Mammosphere-derived MCF-7 cells were seeded and incubated for 24 h and starved with serum-free medium for another 24 h. After starvation, the cells were scratched using a sterile pipette tip and treated with naringenin. Images of the cells were captured at 0, 18, 24, 42, and 48 h after treatment. The results were analyzed using ImageJ and presented as percentage closure (n = 6). (D). Gene expression of EMT and stemness regulators in 2D cells. (E). Gene expression of apoptosis and cell cycle regulators upon naringenin treatment in 2D cells. (F). Gene expression of EMT and stemness regulators in 3D cells. (G). Gene expression of apoptosis and cell cycle regulators upon naringenin treatment in 3D cells. The effect of naringenin on p53 and ESR1 gene expression in 2D (H) and 3D cells (I). Gene expression was determined by q-RT PCR. GAPDH was used as an internal control. The results were analyzed using a comparative threshold cycle (ΔΔCT) and presented as fold change to the untreated control. Results represent the average of three independent experiments (mean ± SD). Statistical analyses were conducted using Student's t-test. *, **, and **** indicate p < 0.05, p < 0.01, and p < 0.0001, respectively.


