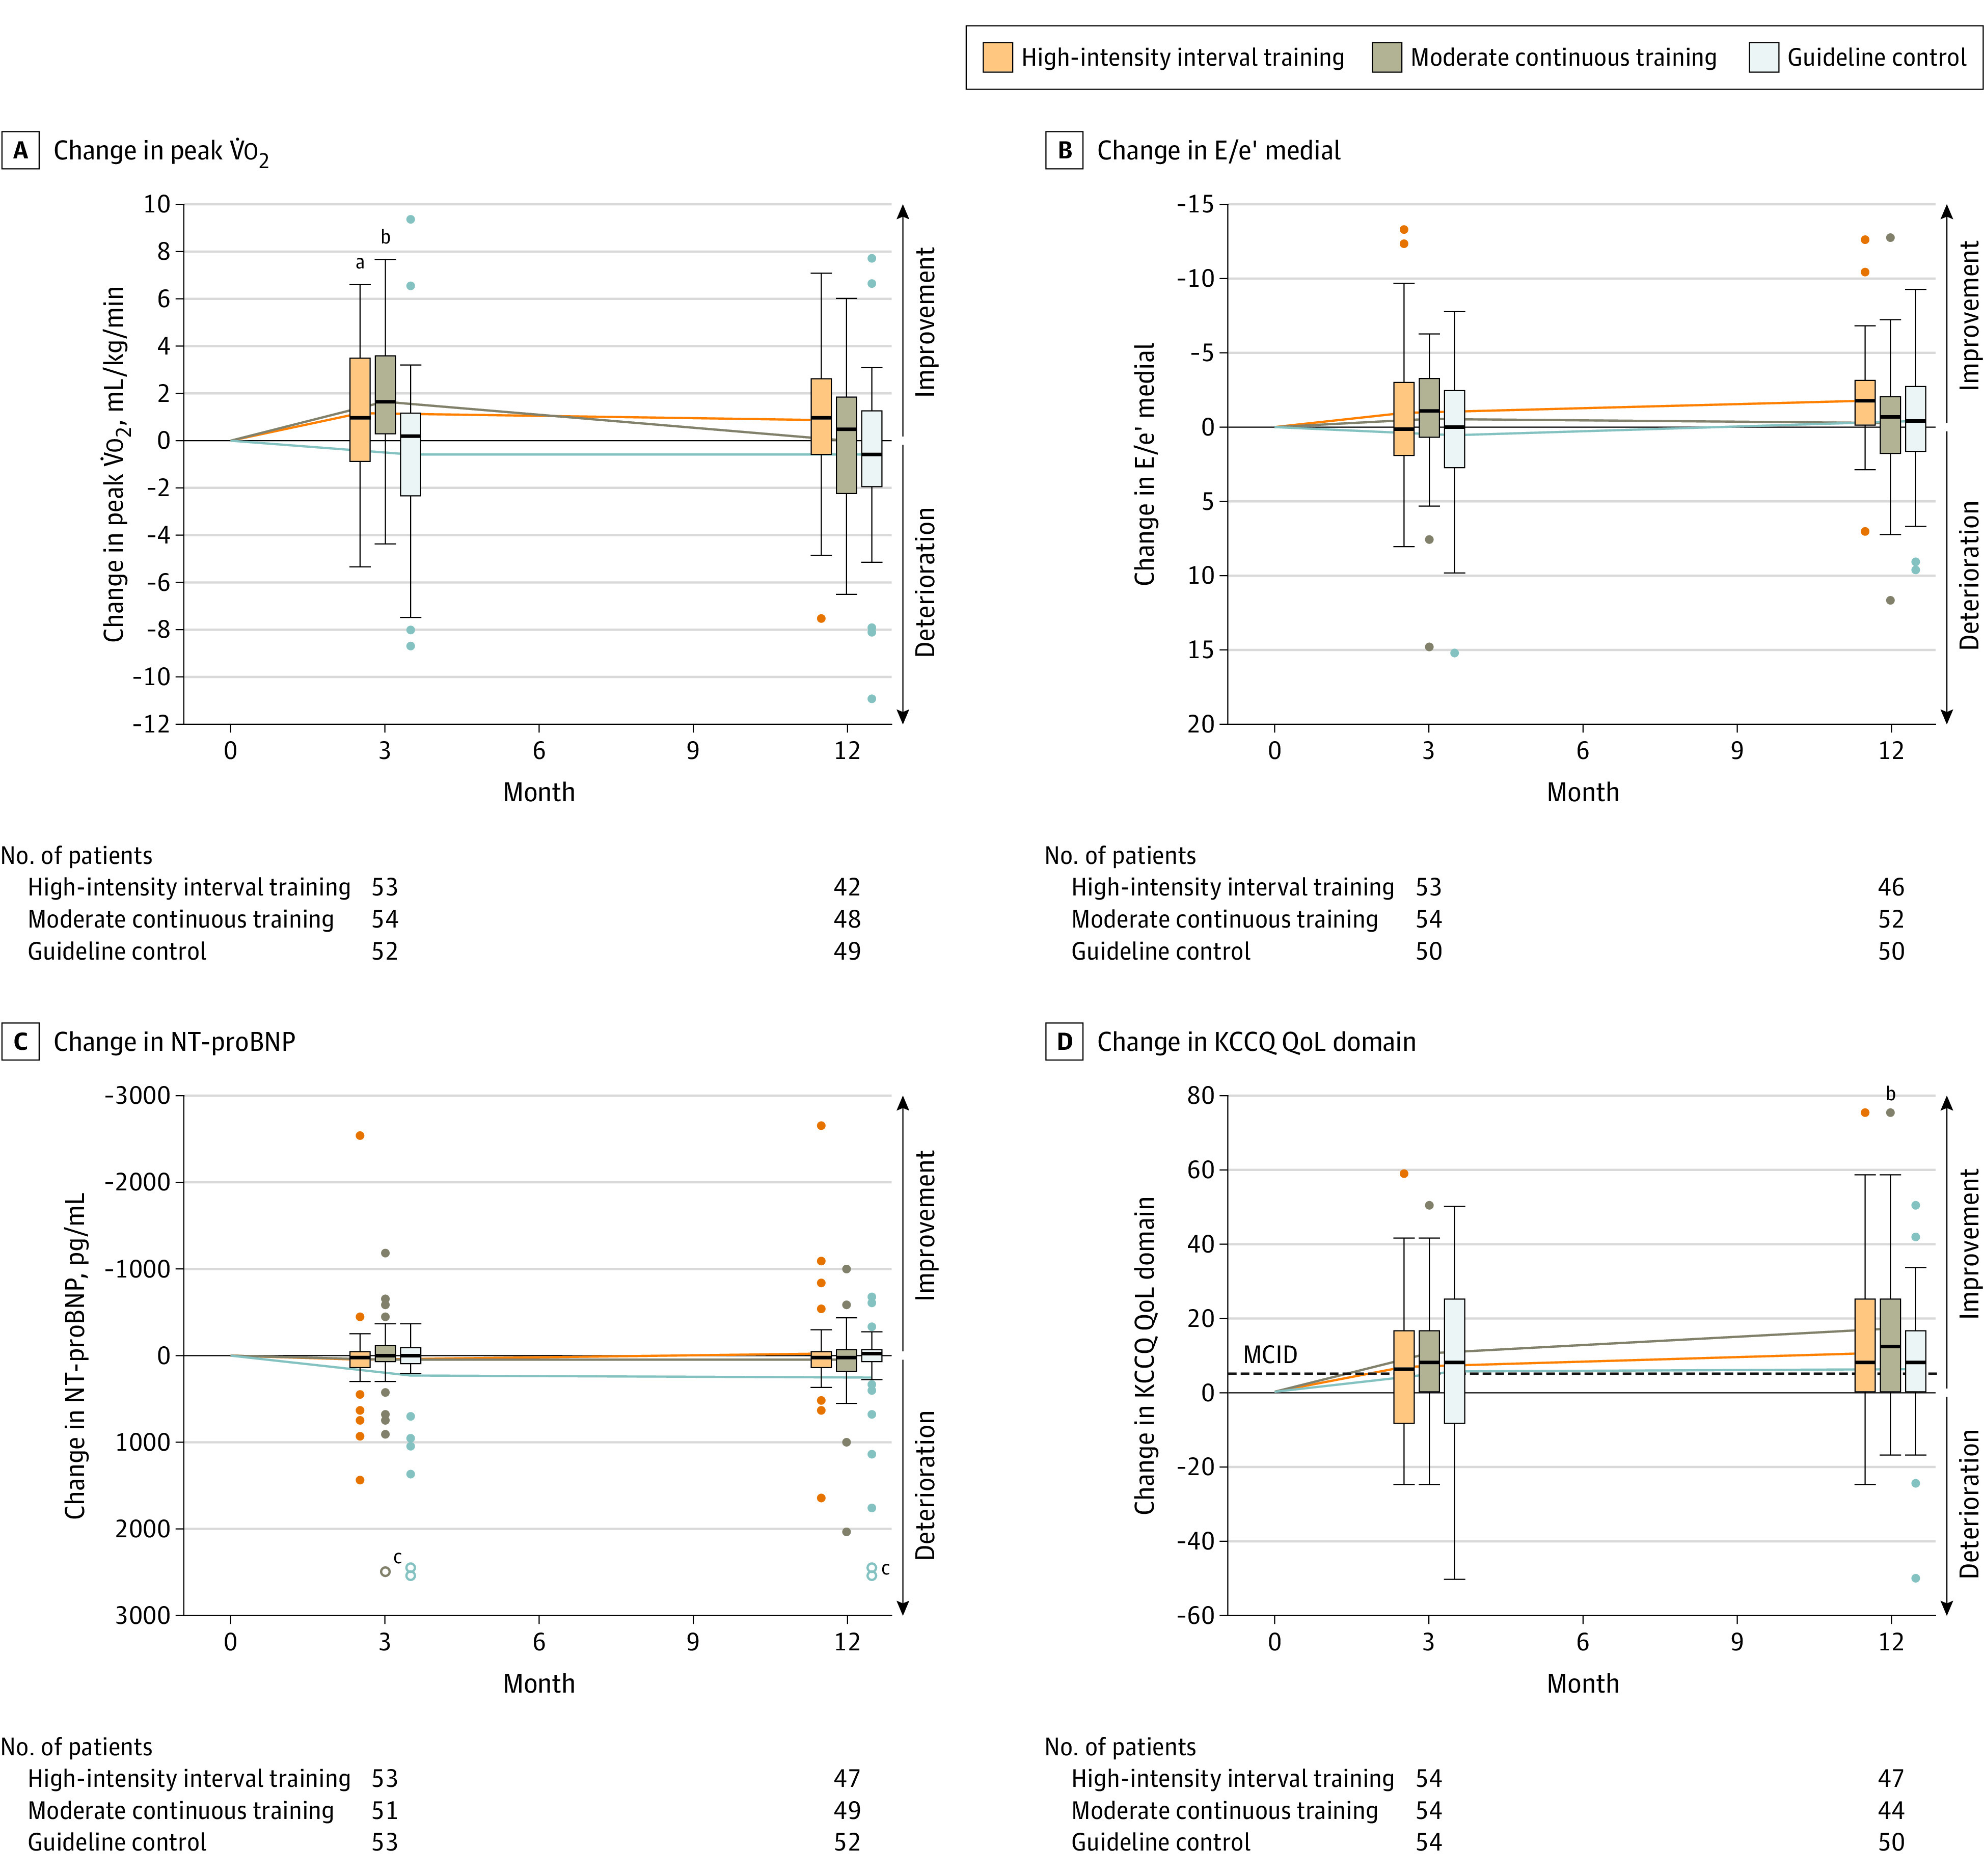
Figure 2. Changes in Peak Oxygen Consumption (V̇o2), Estimated Left Ventricular Filling Pressure (E/e′ Medial), N-Terminal Pro–Brain Natriuretic Peptide (NT-proBNP), and Kansas City Cardiomyopathy Questionnaire (KCCQ) Quality of Life (QoL) at 3 and 12 Months.

Changes are calculated from baseline to 3 and 12 months of intervention within each group (solid lines connect the mean changes from baseline to 3 months and baseline to 12 months). In the KCCQ, higher scores indicate better QoL (score range, 0-100; minimal clinically important difference [MCID, dashed line], 5 points).
aSignificant difference (P < .05) in change between high-intensity interval training and guideline control.
bSignificant difference (P < .05) in change between moderate continuous training and guideline control.
cOpen points are at 3586 pg/mL (moderate continuous training, change to 3 months), 4133 and 5783 pg/mL (guideline control, change to 3 months), 4134 and 7063 pg/mL (guideline control, change to 12 months).
