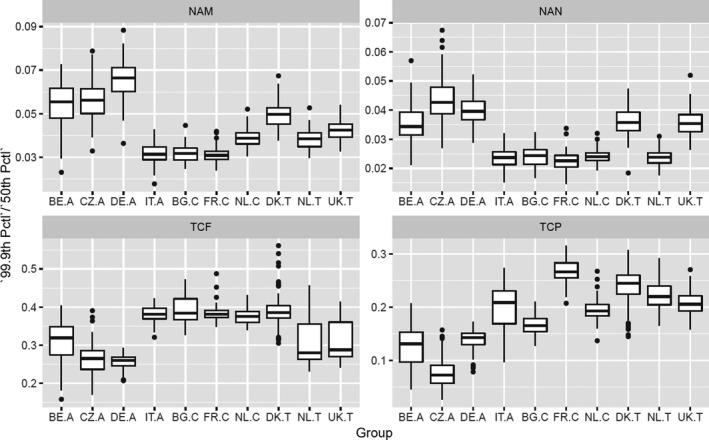
Figure E.4.

Boxplots of the ratio of the 99.9th percentile to the 50th percentile from MCRA bootstrap samples for the different consumer groups. NAM, NAN, TCF and TCP refer to CAG‐NAM, CAG‐NAN, CAG‐TCF and CAG‐TCP, respectively

Boxplots of the ratio of the 99.9th percentile to the 50th percentile from MCRA bootstrap samples for the different consumer groups. NAM, NAN, TCF and TCP refer to CAG‐NAM, CAG‐NAN, CAG‐TCF and CAG‐TCP, respectively