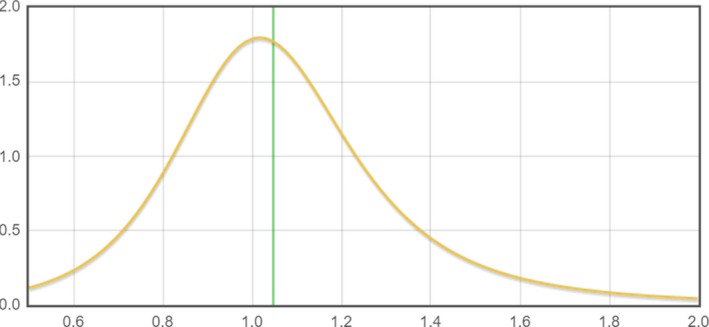
Figure G.3.

Third provisional consensus distribution. This is a Log Student‐t distribution truncated at 0.5 and 2. Considering only the part of the distribution which is shown in this figure, the median is 1.05 and 95% probability interval of 0.63–1.69. See Figure G.4 for the non‐truncated version of this distribution
