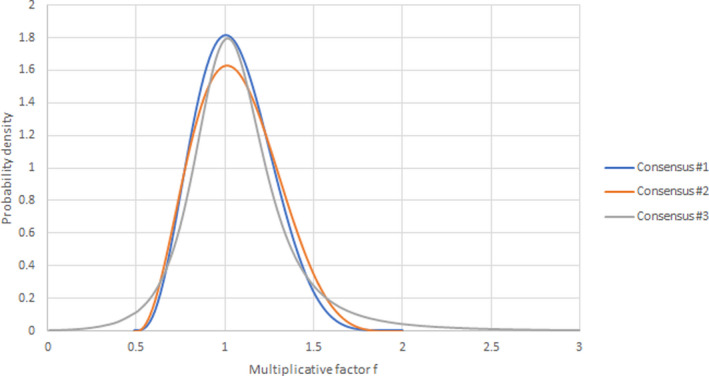
Figure G.4.

Comparison of the three provisional consensus distributions. Consensus #1, #2 and #3 correspond to the distributions shown in Figures G.1, G.2 and G.3, respectively. Note that distribution #3 is truncated at the consensus plausible bounds of 0.5 and 2 in Figure G.3, but actually extends beyond those bounds at both ends as can be seen here. The non‐truncated version of consensus distribution #3 has a median of 1.04 and 95% probability interval of 0.56–1.97
