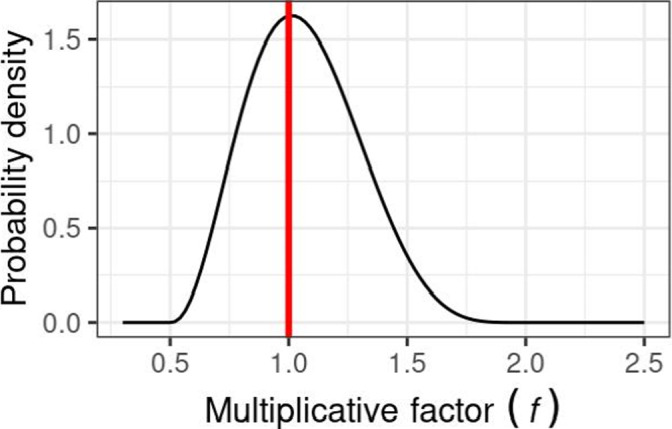
Figure G.7.

Alternative distribution, which was also considered reasonable by the experts, though less preferred than the distribution in Figure G.6 and will be used in sensitivity analysis. This is a Scaled beta distribution with alpha = 3.39 and beta 5.60, beta = 4.6 and limits of 0.5 and 2. The red line shows f = 1, i.e. no change in MOET
