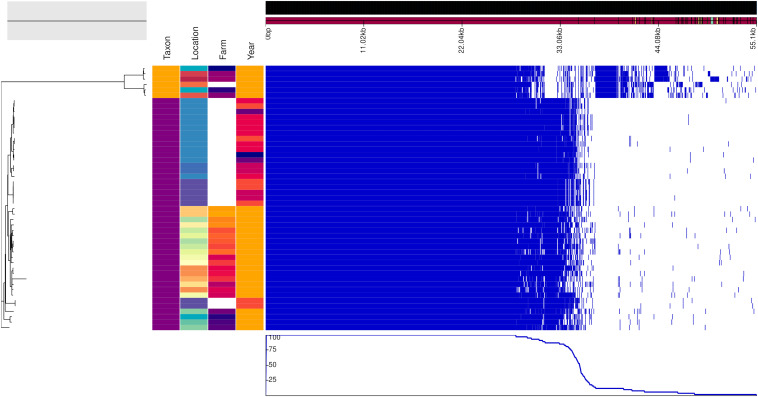
FIGURE 3.
Genealogy of mice-associated Campylobacter lineage (left) with associated metadata, i.e., taxon (A. flavicollis in purple and M. minutus in orange), location, farm (if applicable) and year (2017 in orange, 2015 in dark orange, 2014 in light red, 2013 in dark red, 2011 in violet, and 2010 in blue), displayed alongside the gene presence (blue)/absence (white) plot from the Roary pangenome analysis. The figure was drawn using the phandango.net web application (Hadfield et al., 2017). The phylogeny based on 1,402 core genes was reconstructed using ClonalFrameML (Didelot and Wilson, 2015) and rooted at mid-point.

