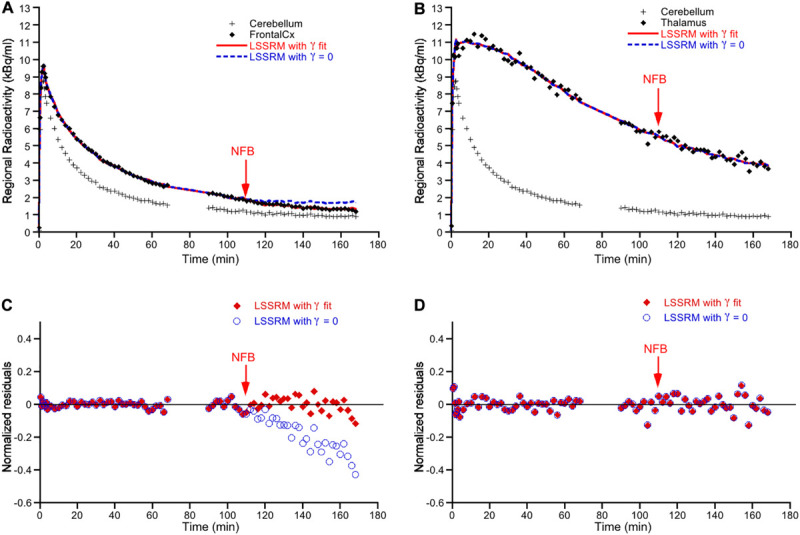
FIGURE 2.

Representative time-activity curves of [18F]Fallypride binding in the frontal cortex (A) and thalamus (B) in one subject. Time-activity data in cerebellum, used as reference region in the model, is also displayed. The vertical arrow represents the time at which neurofeedback (NFB) was initiated (i.e., 110 min post-radiotracer injection). For each target brain region, the symbols correspond to the experimental measured values, the solid red line corresponds to the fitted curve obtained according to the LSSRM with γ fit, and the dashed blue line corresponds to the fitted curve obtained according to LSSRM but with γ fixed to 0. The LSSRM with γ fit yielded a t-score of 9.89 in frontal cortex and 0 in thalamus in this subject. Panels (C,D) show the normalized residuals [(PET – model)/PET] of the model fit with the γ parameter (closed red symbols) and with γ fixed to zero (blue open symbols) in frontal cortex and thalamus, respectively. The inclusion of γ in the LSSRM led to an improvement of the model fit in frontal cortex but not in thalamus.
