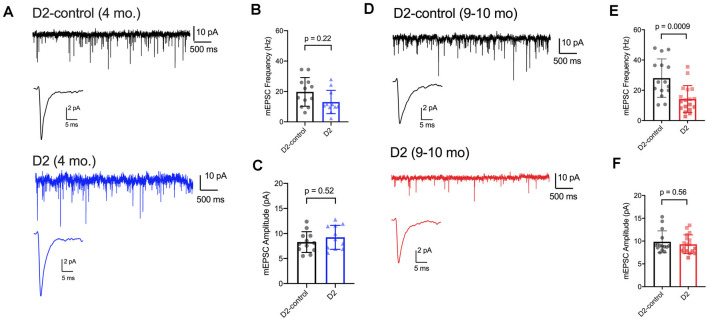
Figure 6.
mEPSC frequency was reduced in D2 mice. (A) Whole-cell voltage-clamp records of mEPSCs recorded in the absence of stimulation for 4 m D2-control (n = 12 cells from five mice) and D2 mice (n = 11 cells from four mice). Single events are the average of events detected in each cell. (B) Mean ± SD of mEPSC frequency was slightly reduced in 4 m D2 mice. Individual points show the average instantaneous frequency for all events from individual cells. The difference was not statistically significant when assessed with a nested t-test. (C) mESPC amplitude was not different between 4 m D2-controls and D2 mice. (D) mEPSCs recorded from TC neurons from 9 m D2-control (n = 15 cells from four mice) and D2 mice (n = 18 cells from six mice). (E) mEPSC frequency was reduced at 9 m. (F) mEPSC amplitude was similar in D2-control and D2 TC neurons at 9 m.

