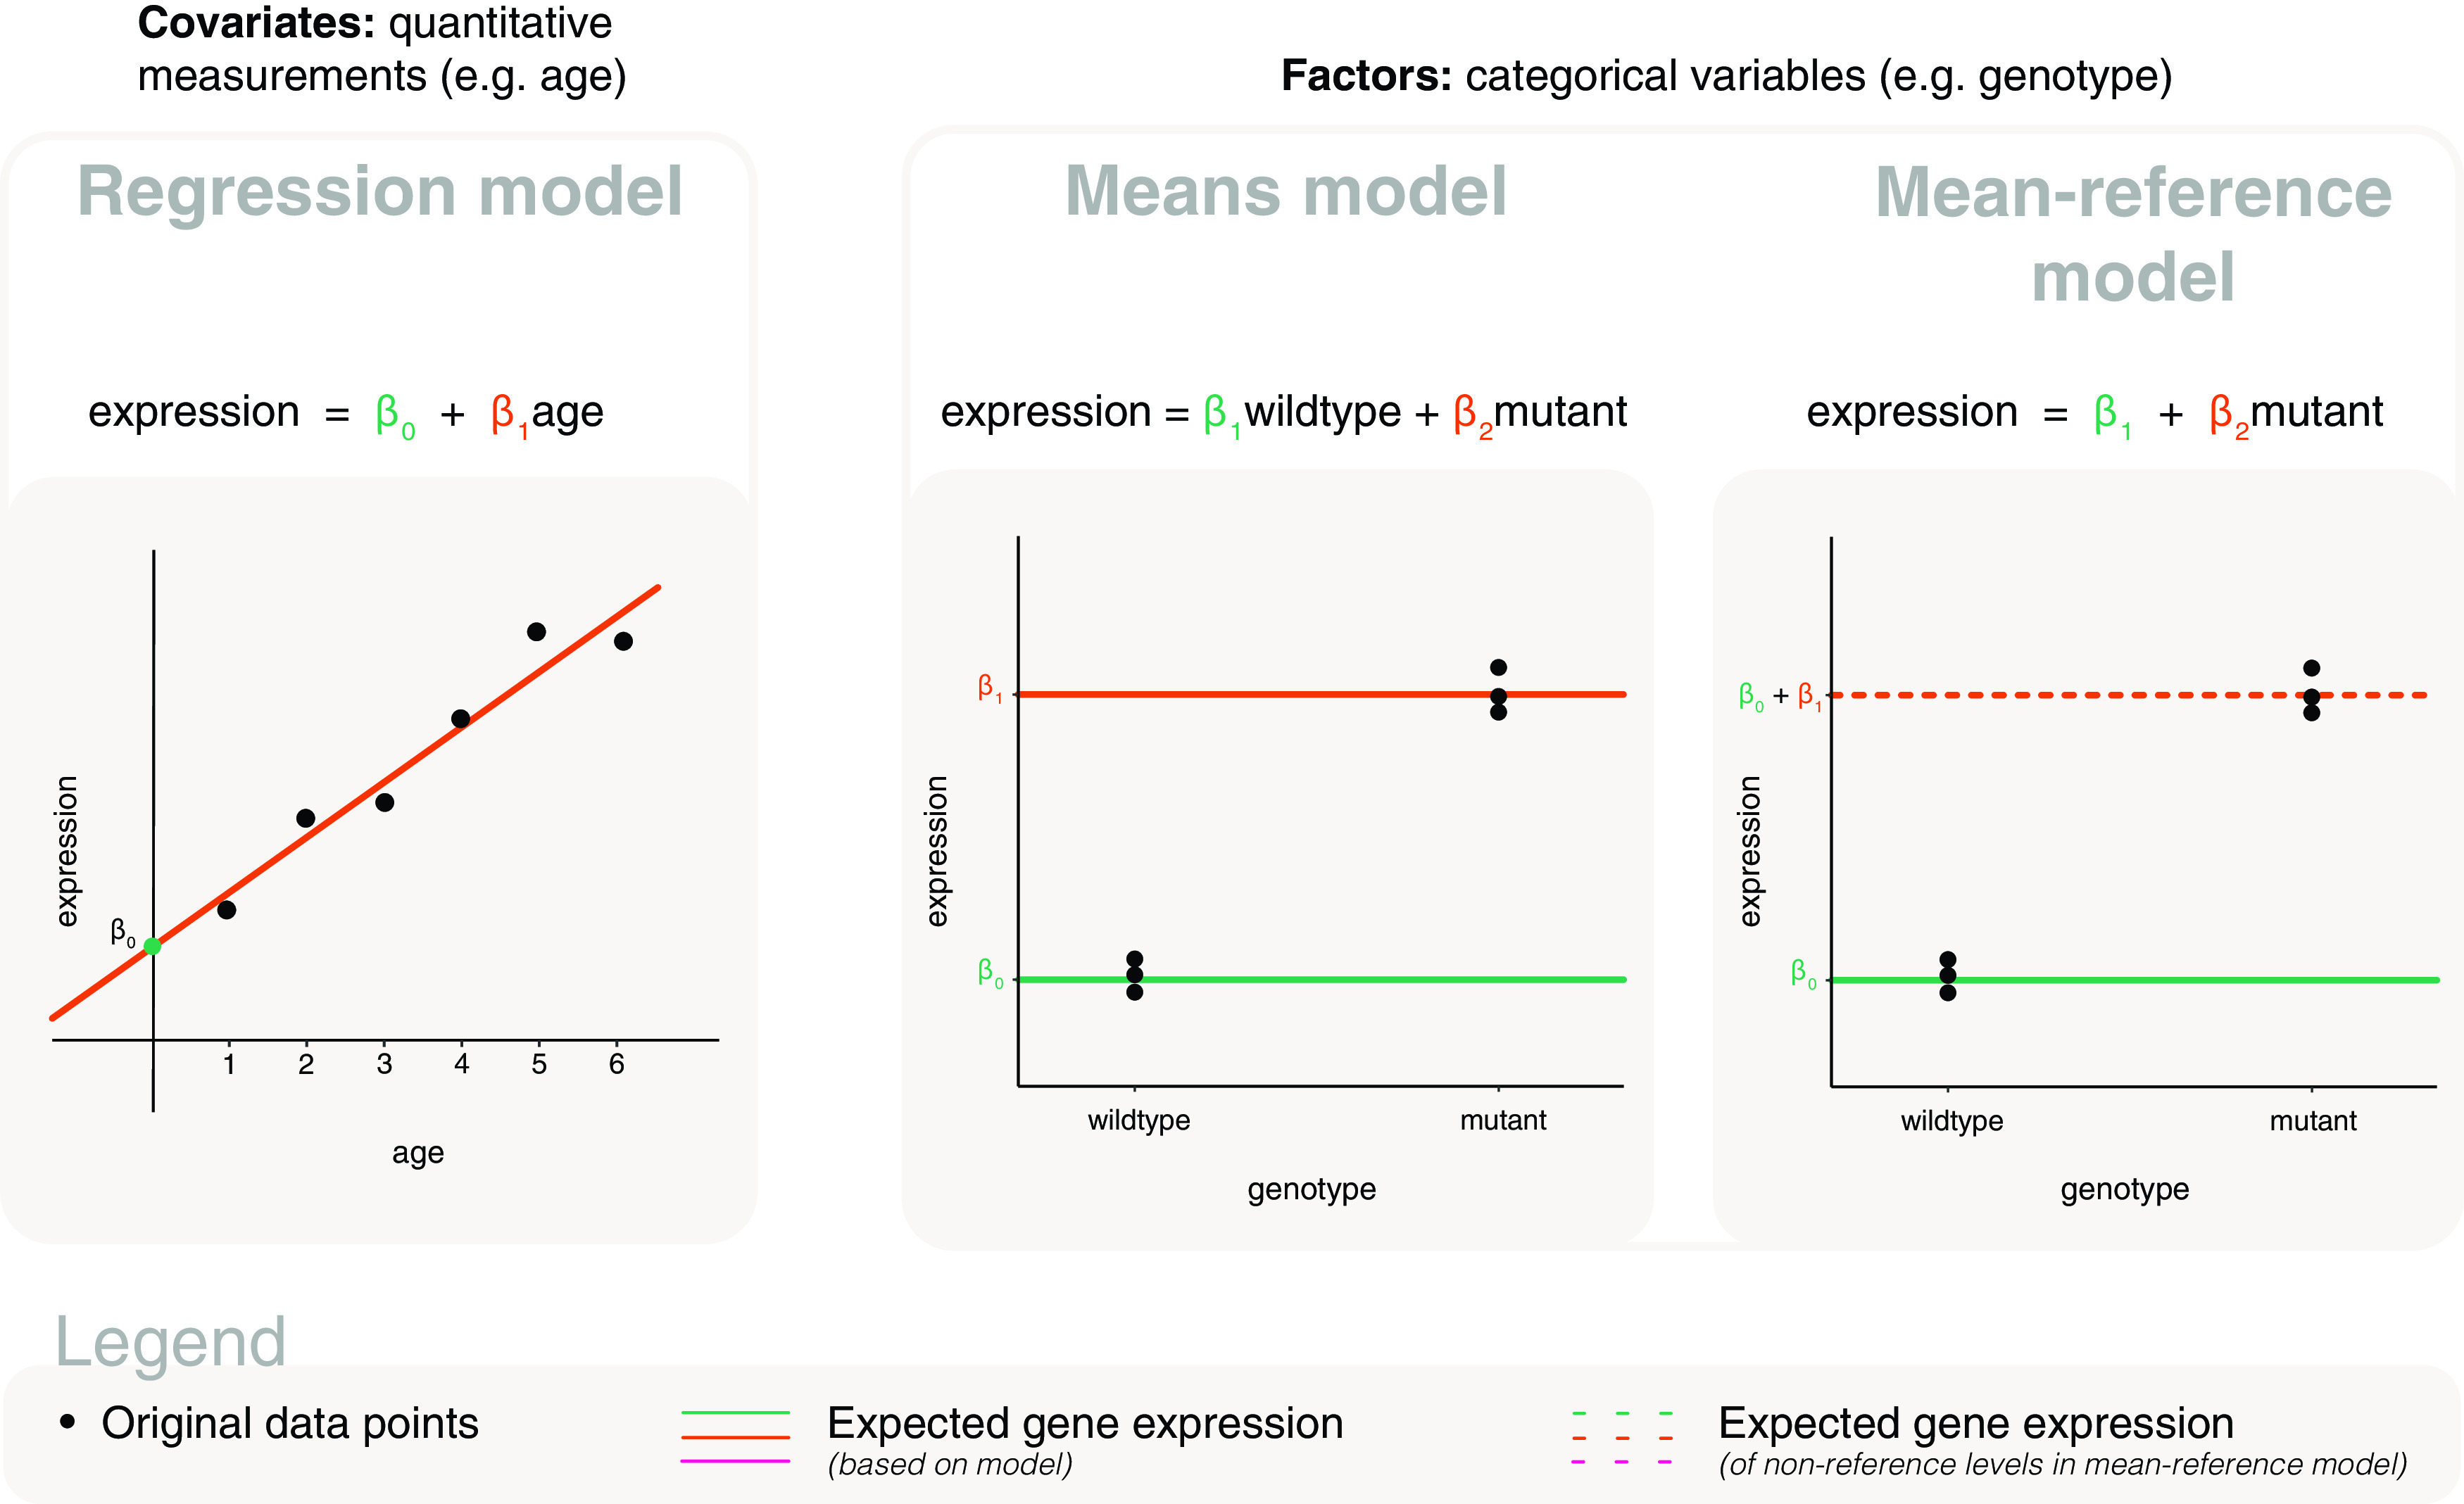
Figure 1. Basic models for covariate and factor explanatory variables.

LEFT: The basic model for covariates is referred to as a regression model, which is a line defined by the model parameters β 0 the y-intercept, and β 1 the slope. CENTER: One of two basic models for factors is referred to as a means model, where model parameters are calculated as the mean gene expression of each level of the factor e.g. β 1 represents the mean expression for wildtype and β 2 represents the mean of mutant. RIGHT: The other basic model we refer to for factors is a mean-reference model, where the first model parameter is calculated as the mean gene expression of the reference level, and subsequent parameters are calculated relative to the reference level e.g. β 1 represents the mean expression for wildtype and β 2 represents the difference between mutant and wildtype. In each plot, the points represent the original data; coloured lines are used to represent expected gene expression, where dashed lines are specifically used to represent expected gene expression for non-reference levels in the mean-reference model e.g. mutant.
