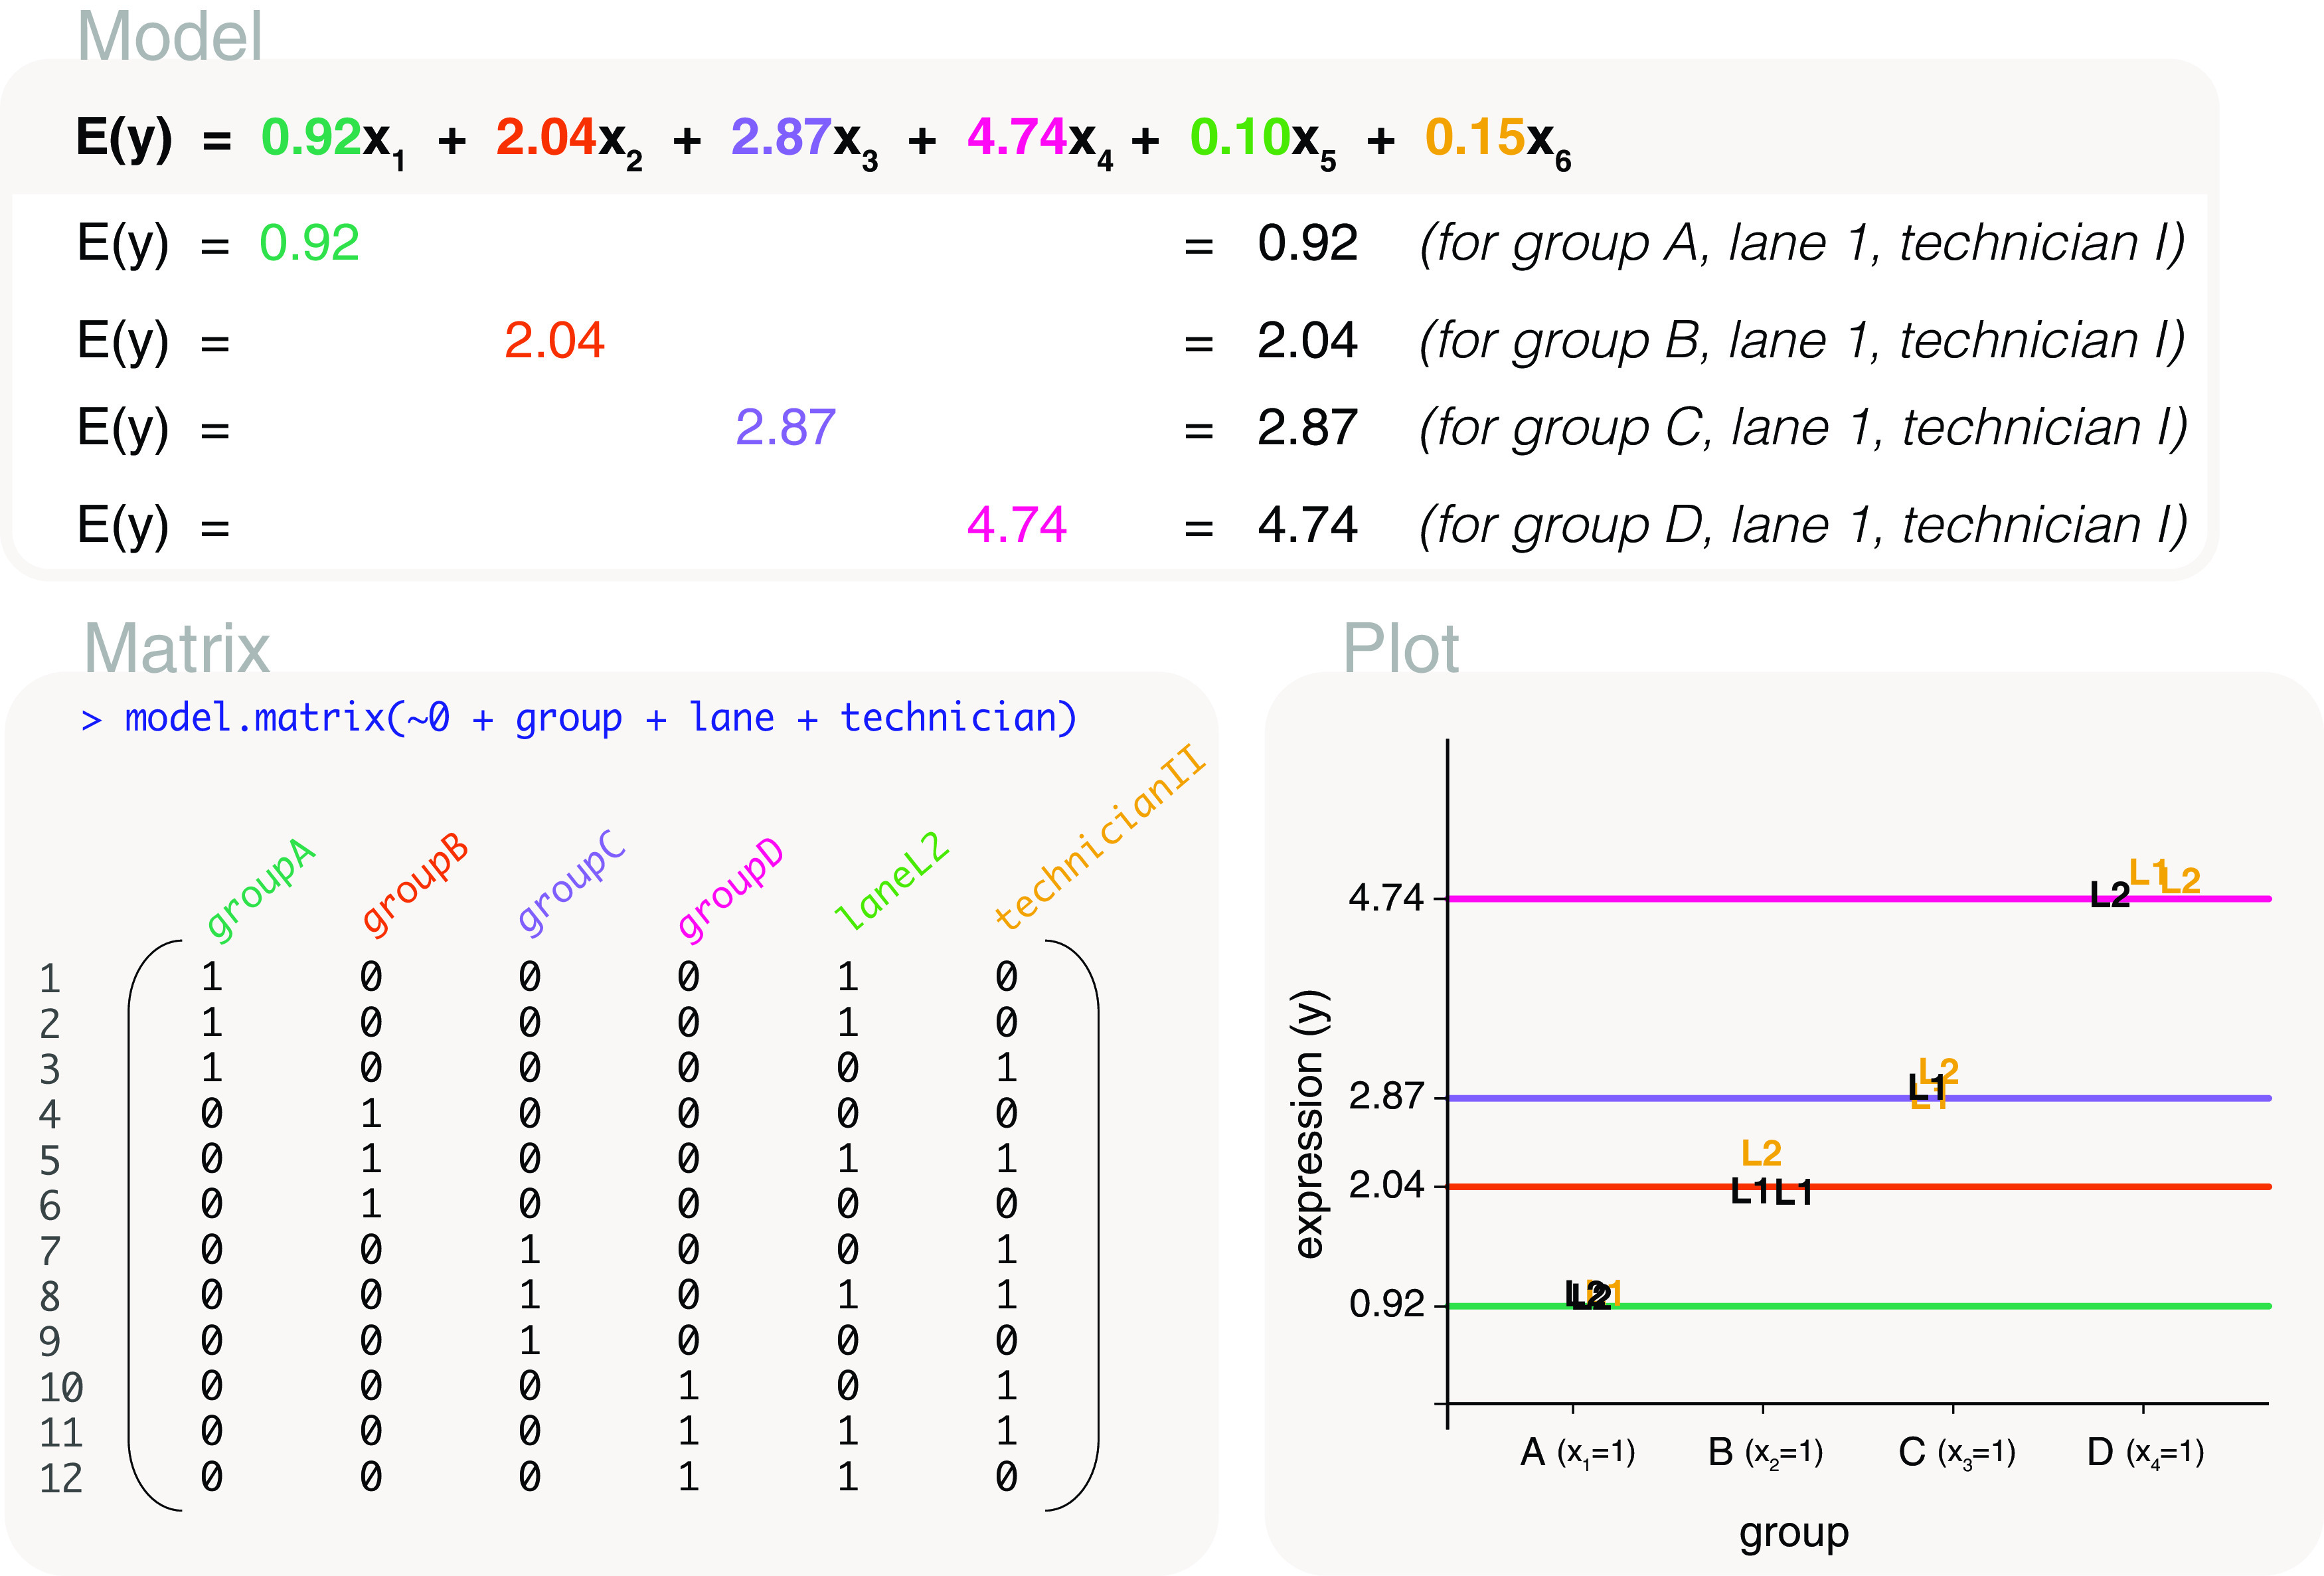
Figure 12. Expected gene expression is modelled by a group factor and two additional factors that are not of interest (lane and technician).

The design matrix excludes the intercept term for the first factor added to the function. Only lines reflecting the first 4 parameters are drawn in the plot, representing the mean gene expression of groups A, B, C and D in lane L1 and with handling technician I. Samples are labelled by their sequencing lane (L1 or L2), and coloured black if they are processed by technician I, yellow if they are processed by technician II.
