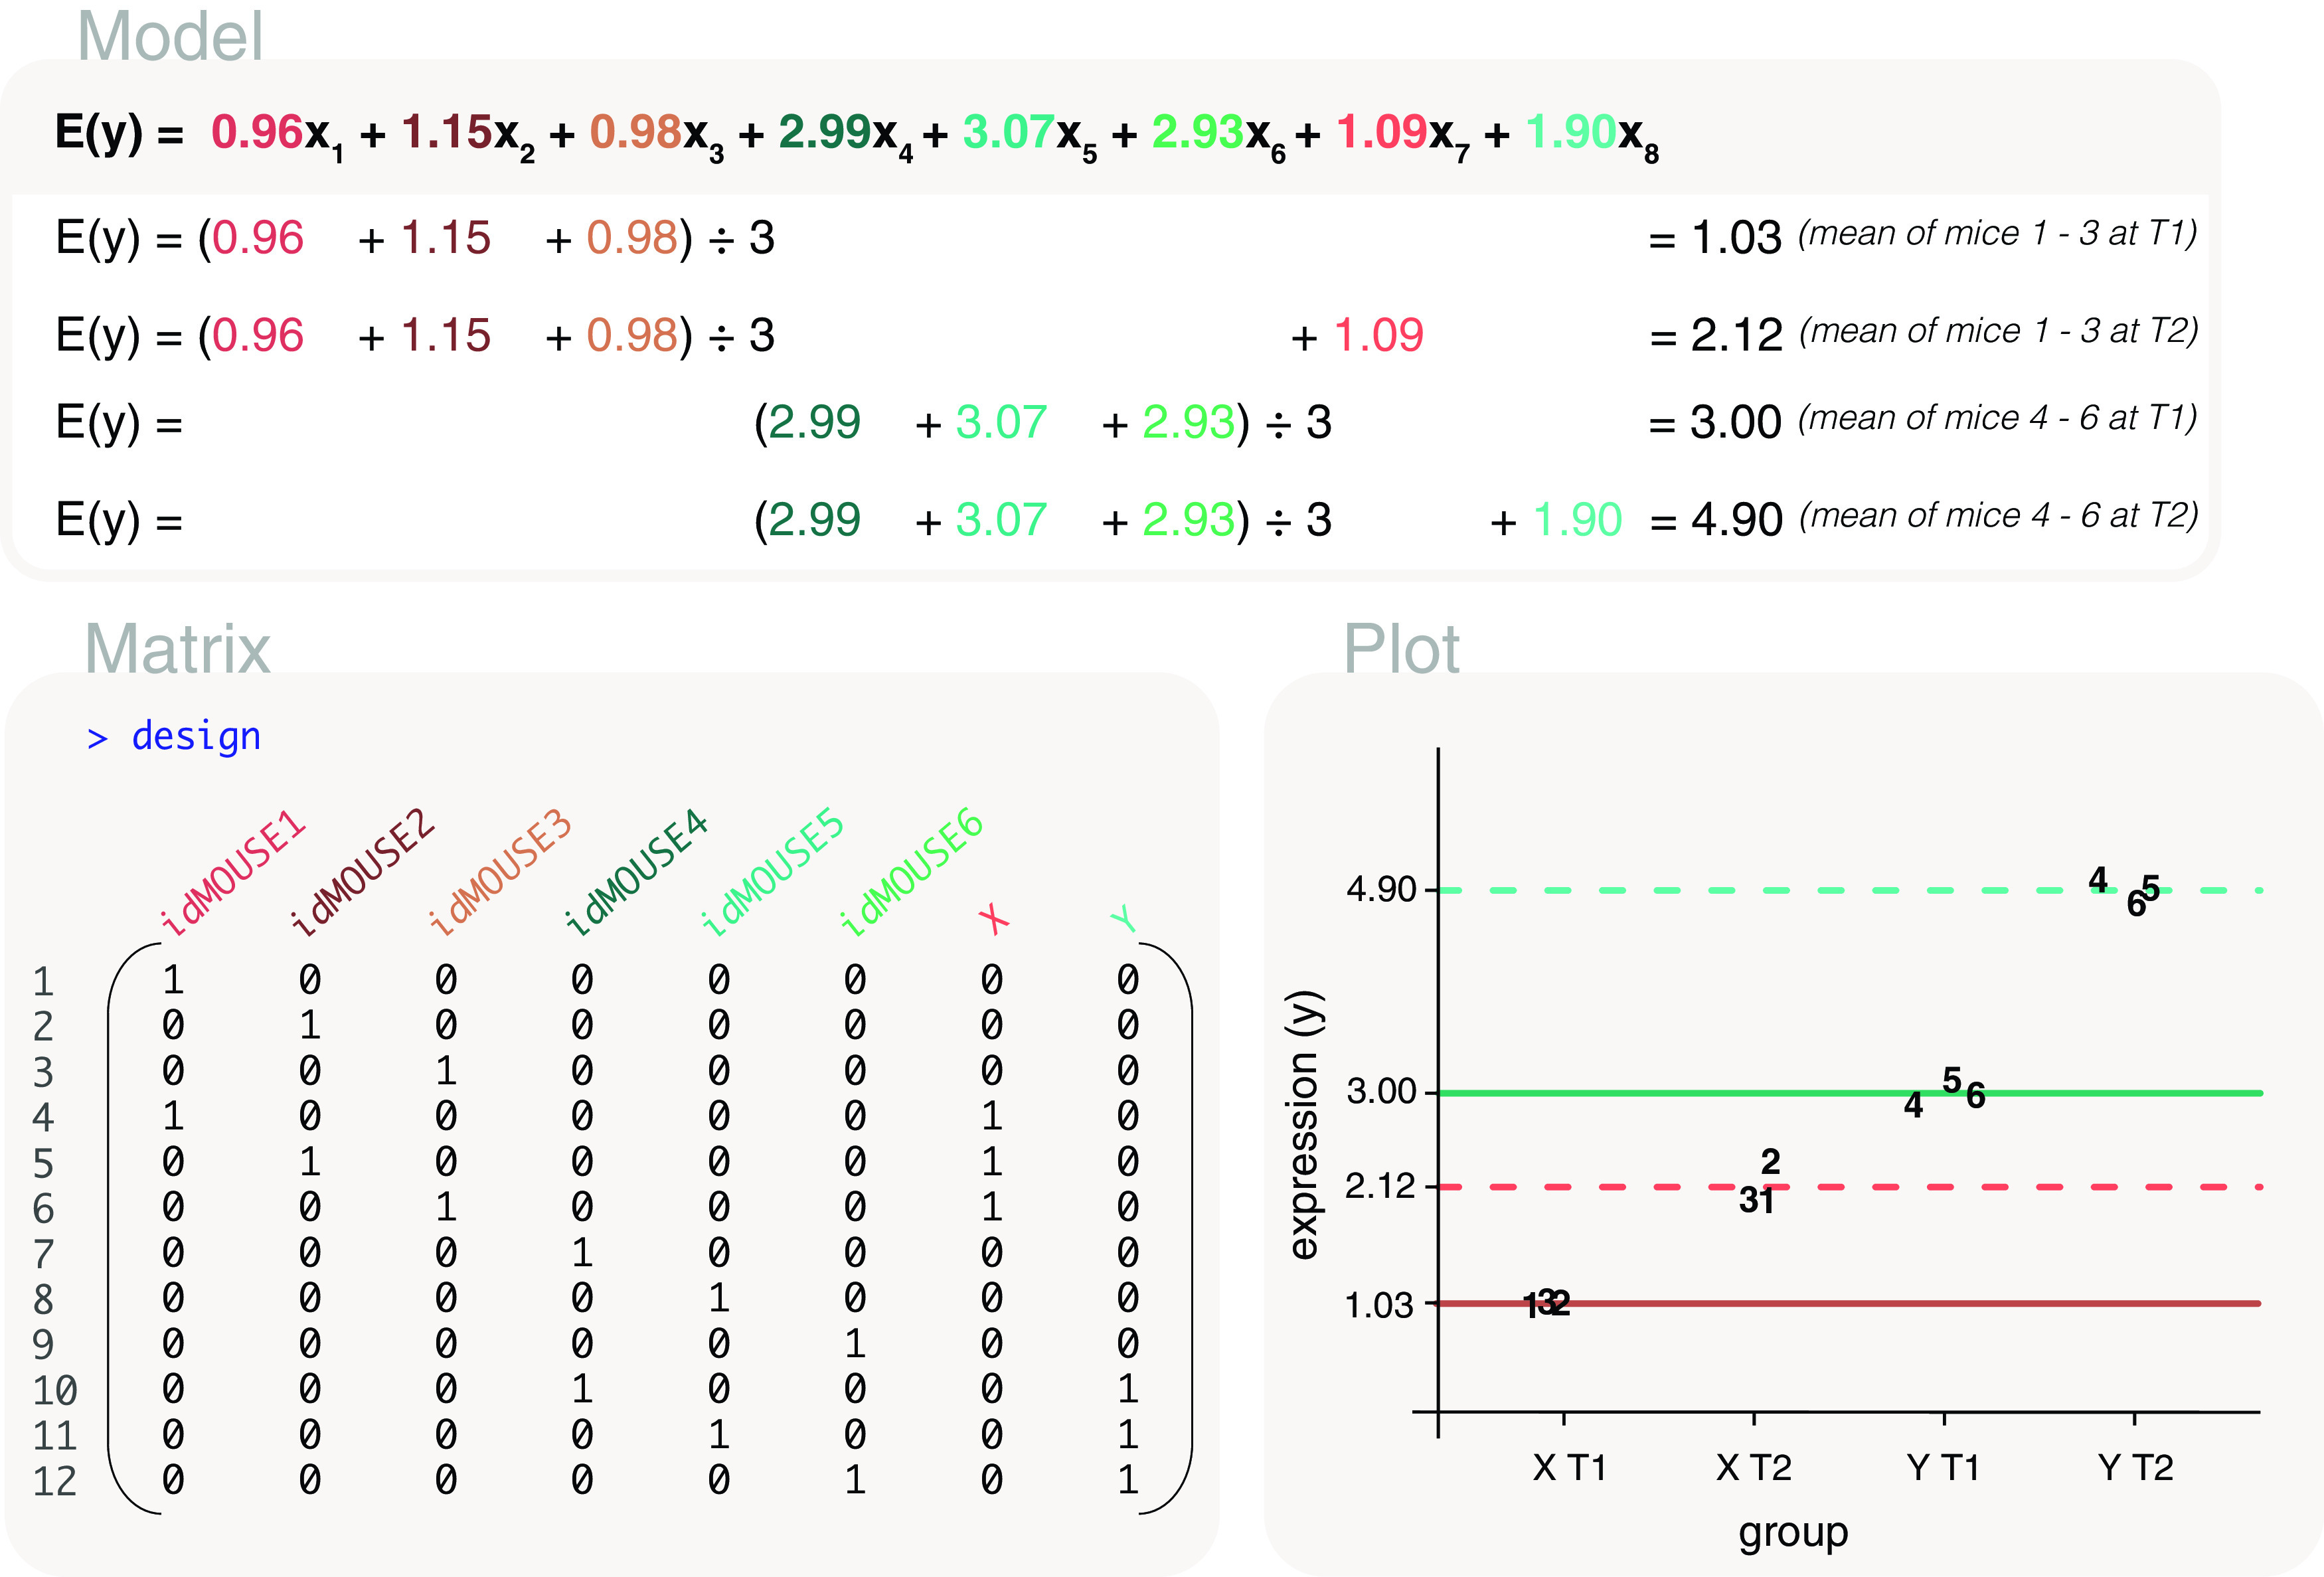
Figure 13. We model the expected gene expression of mice that have been given either treatment X or treatment Y, with samples taken at timepoints T1 and T2.

Repeated measurements are taken from mice, as indicated by the numbers in the plot, such that label ”1” represents MOUSE1. A custom design matrix is created to model mouse IDs, treatment and timepoint (complete R code shown in the main article). Fitted lines are drawn in pink for treatment X, and in aqua for treatment Y. Solid lines represent expected gene expression at timepoint T1, and dashed lines for timepoint T2.
