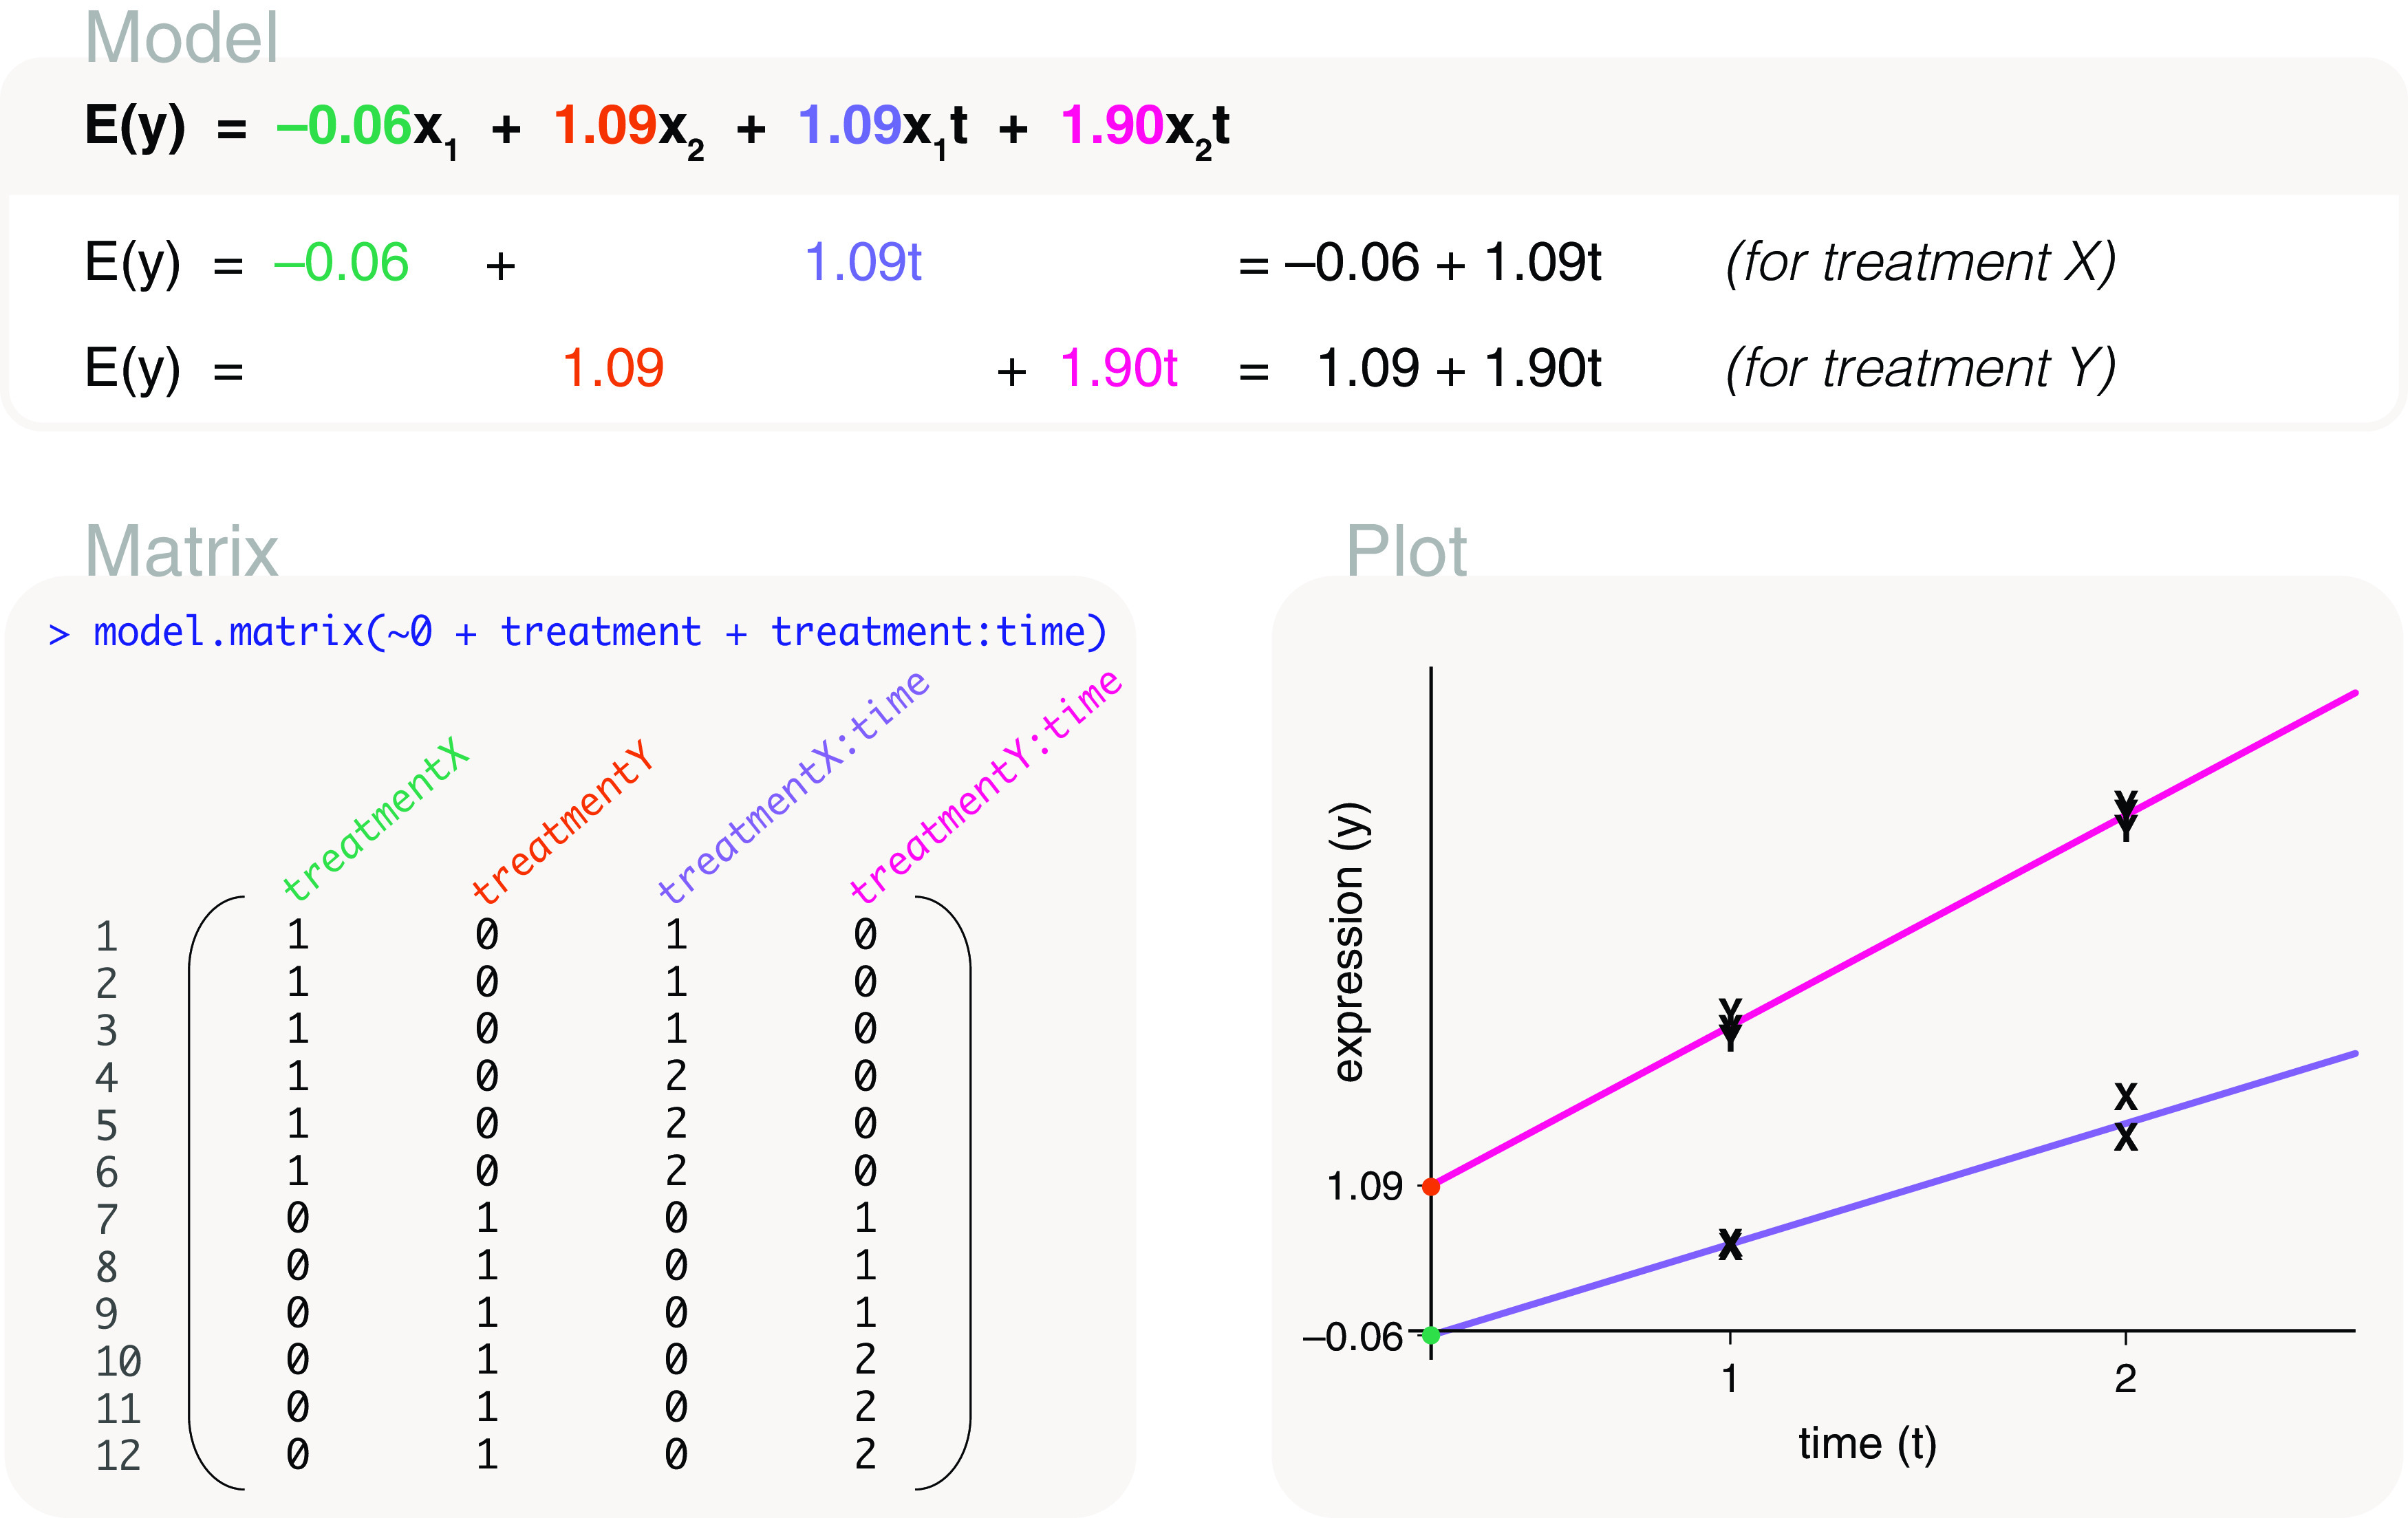
Figure 15. Expected gene expression is modelled by time as a covariate and treatment as a factor.

In the plot, data points are labelled by treatment, and a fitted line is drawn for each of the treatments.

In the plot, data points are labelled by treatment, and a fitted line is drawn for each of the treatments.