
Figure 6. Expected gene expression is modelled by a group factor, where x 1 is an indicator variable for healthy mice ( x 1 = 1 for healthy; 0 otherwise), and x 2 is an indicator variable for sick mice ( x 2 = 1 for sick; 0 otherwise).
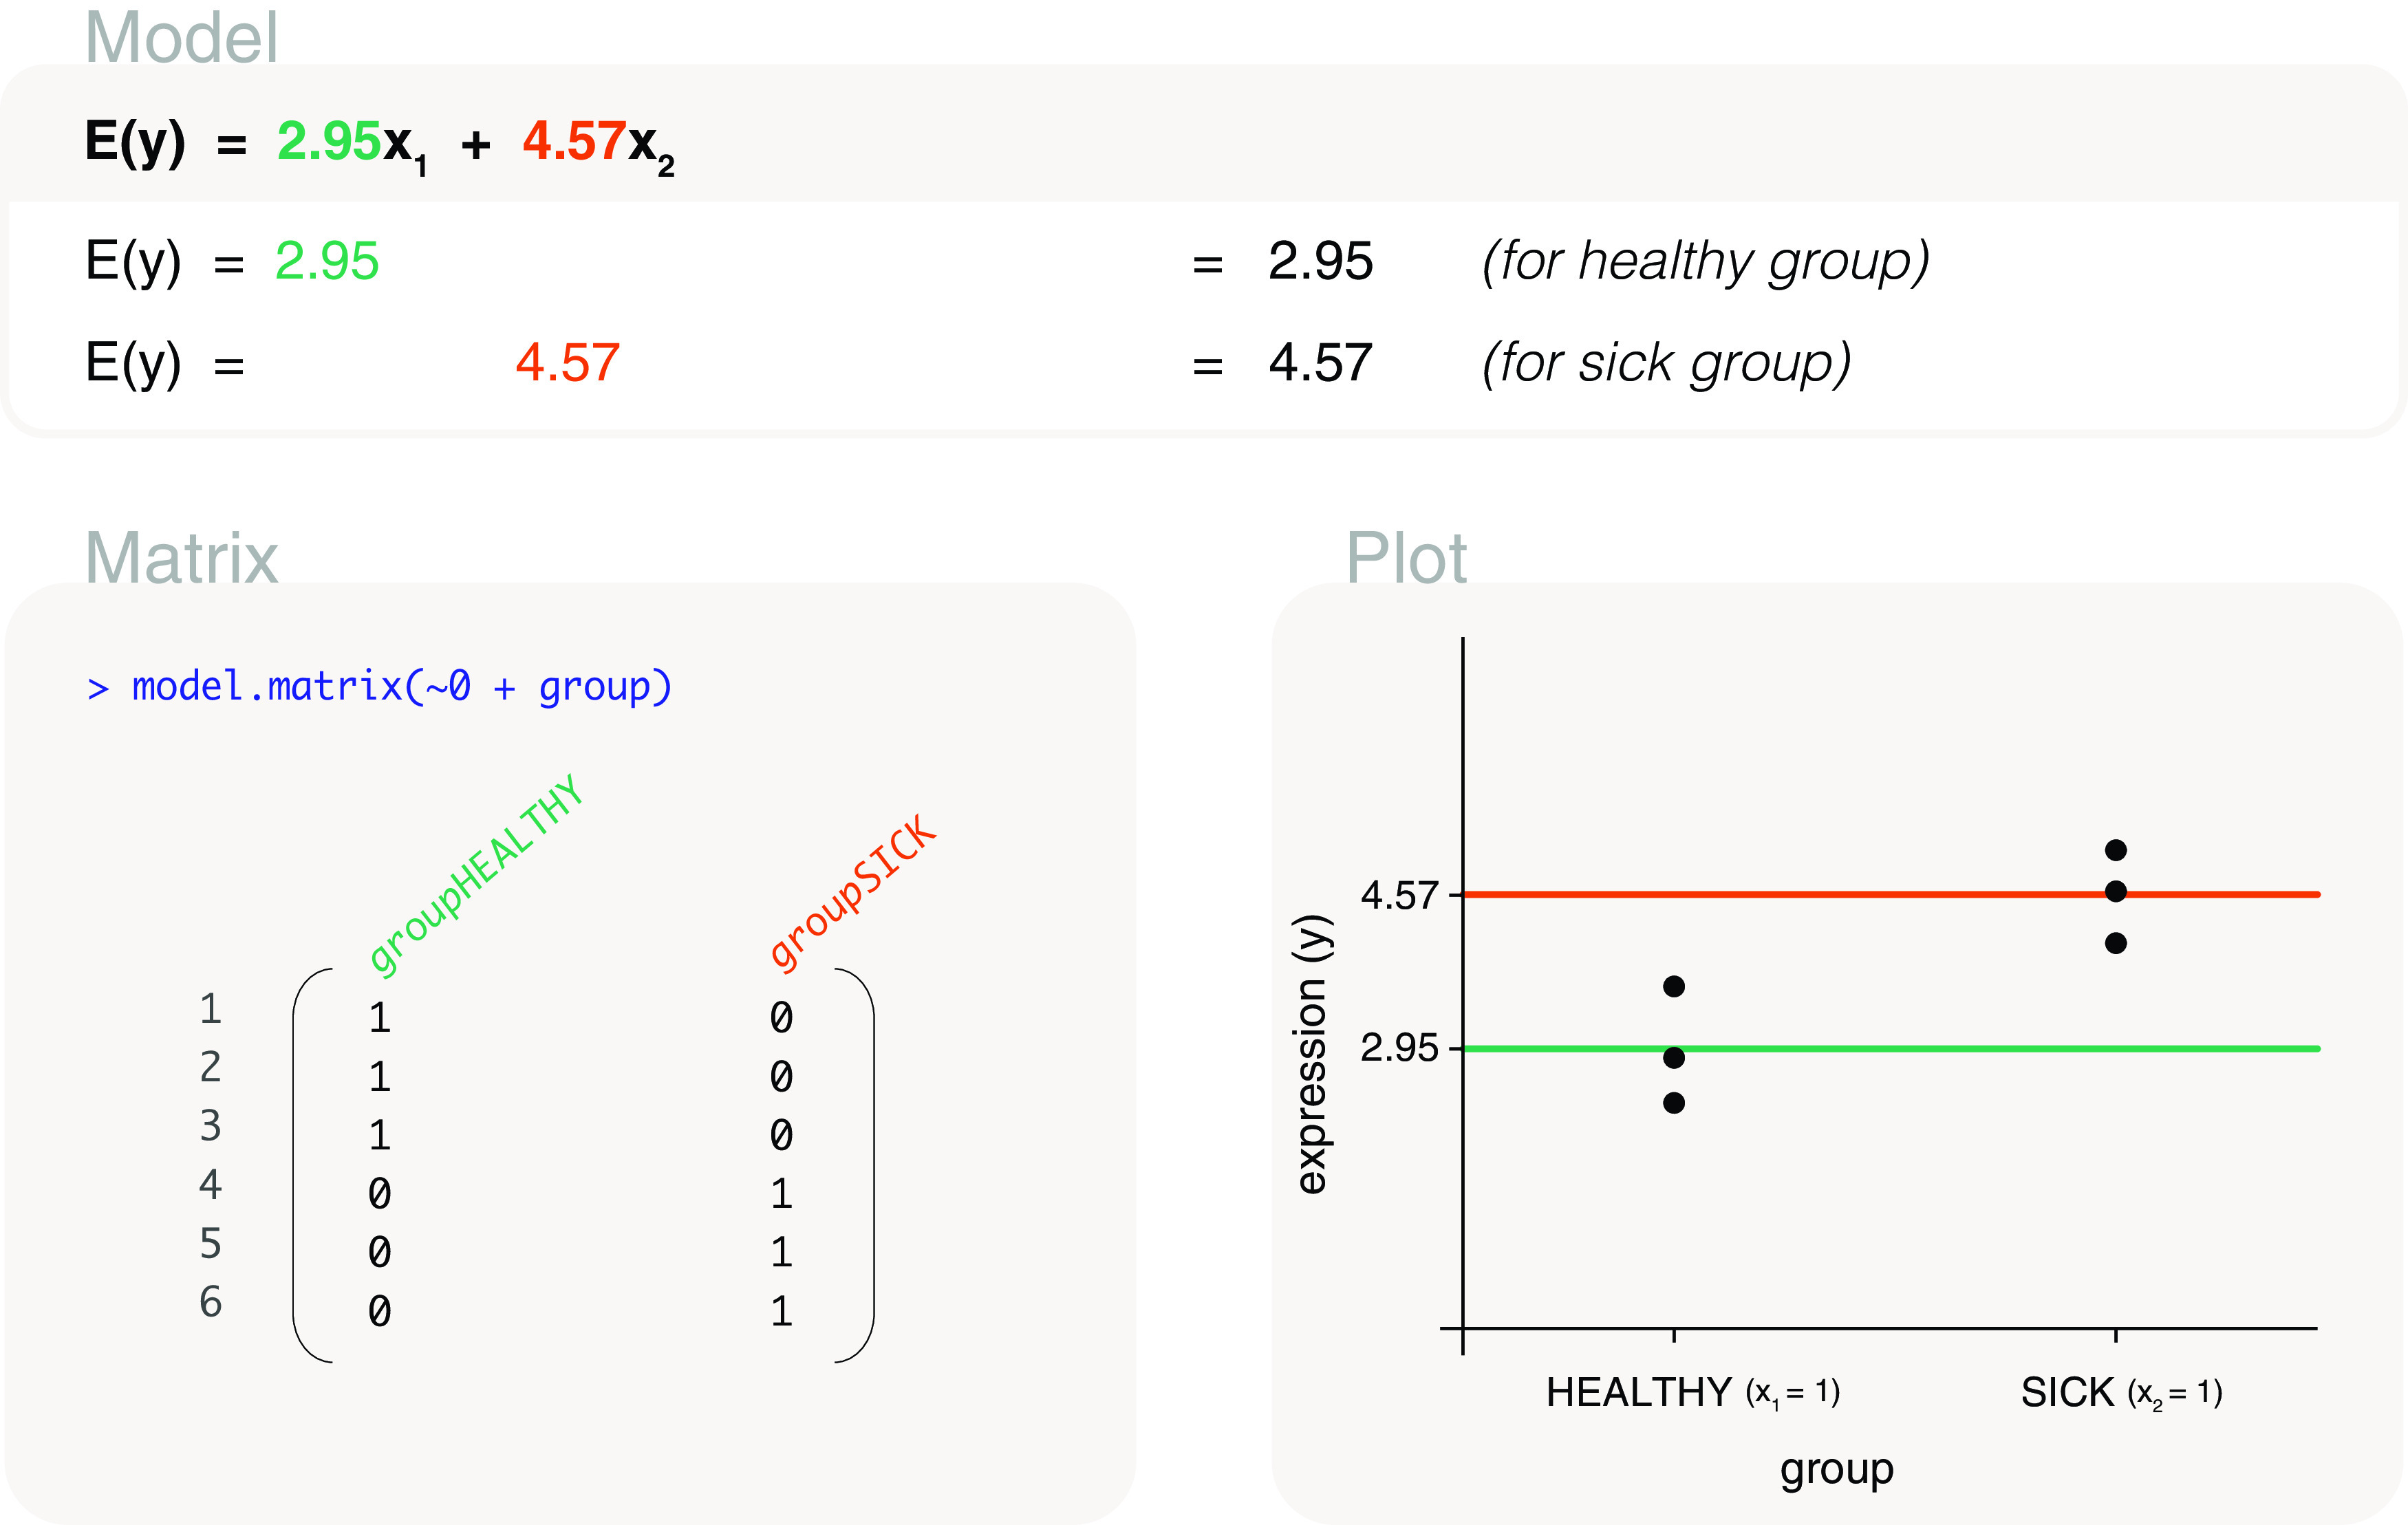
The associated design matrix excludes an intercept term.