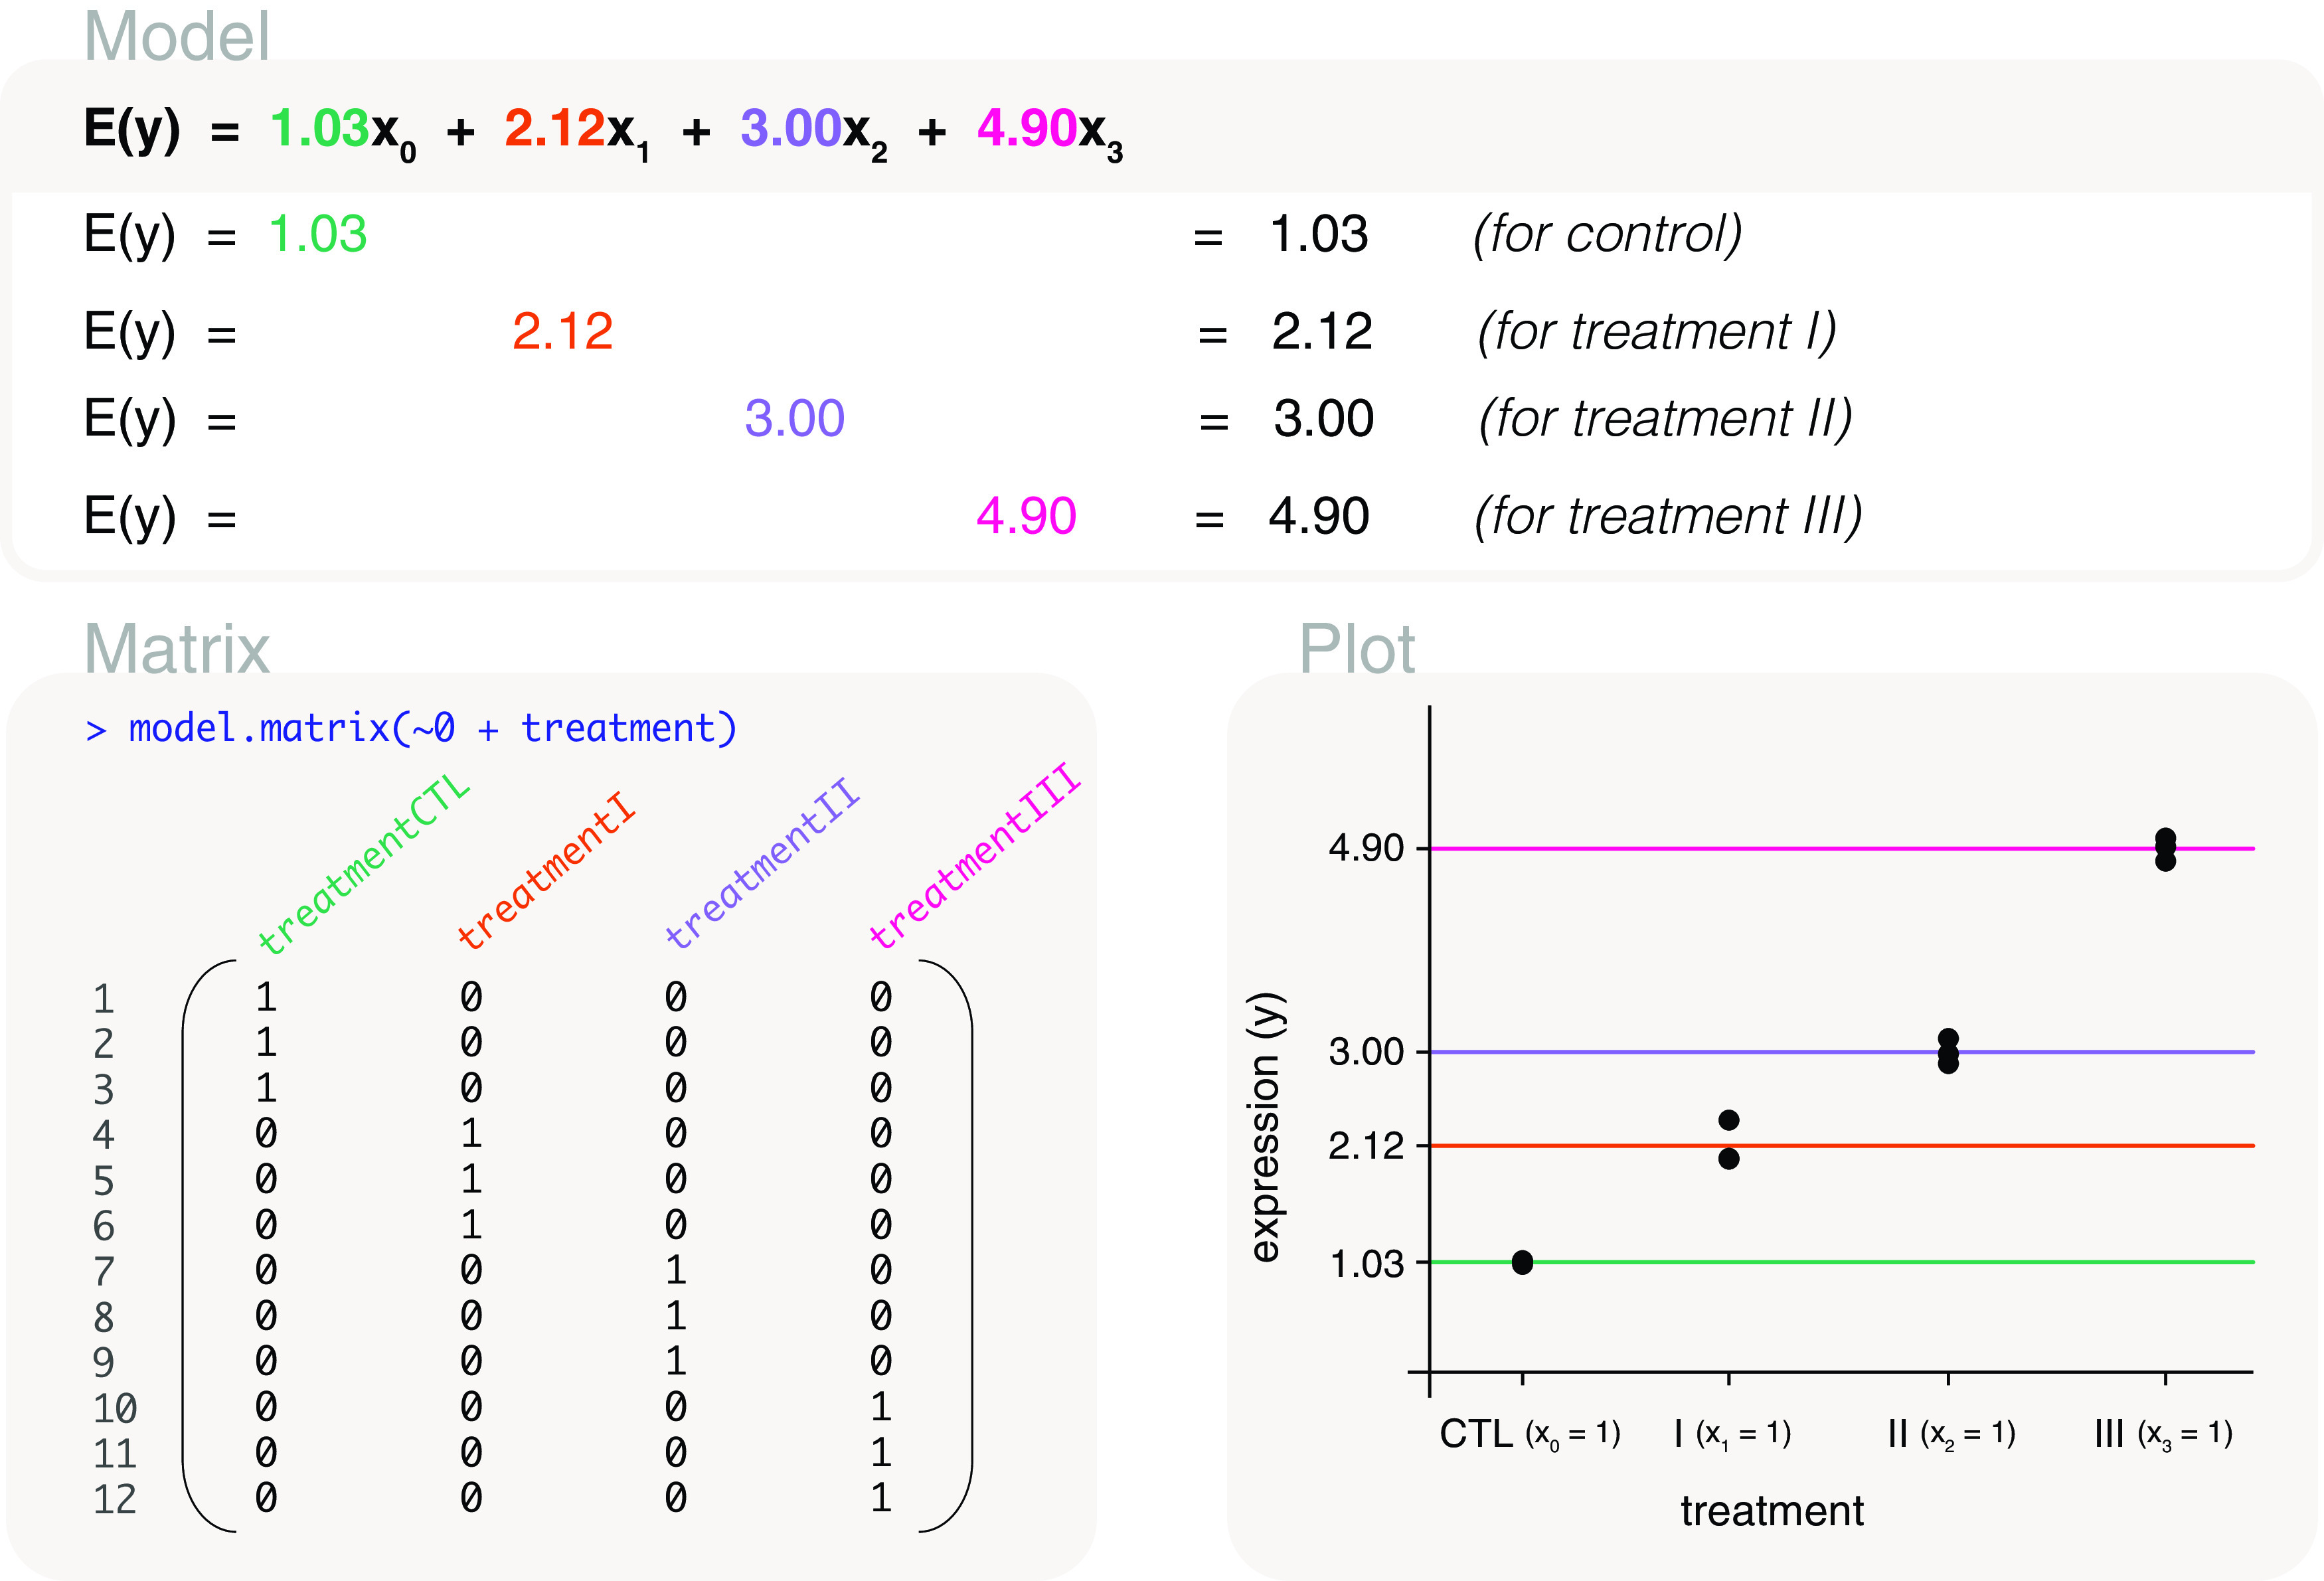
Figure 8. Expected gene expression is modelled by a treatment factor.

The design matrix that is used excludes the intercept term so that the associated model is a means model. In other words, the mean gene expression of each level in ‘treatment’ is represented by a parameter in the model. The x’s in the model are indicator variables for control and treatment groups, with x 0 = 1 for control, x 1 = 1 for treatment I, x 2 = 1 for treatment II, and x 3 = 1 for treatment III.
