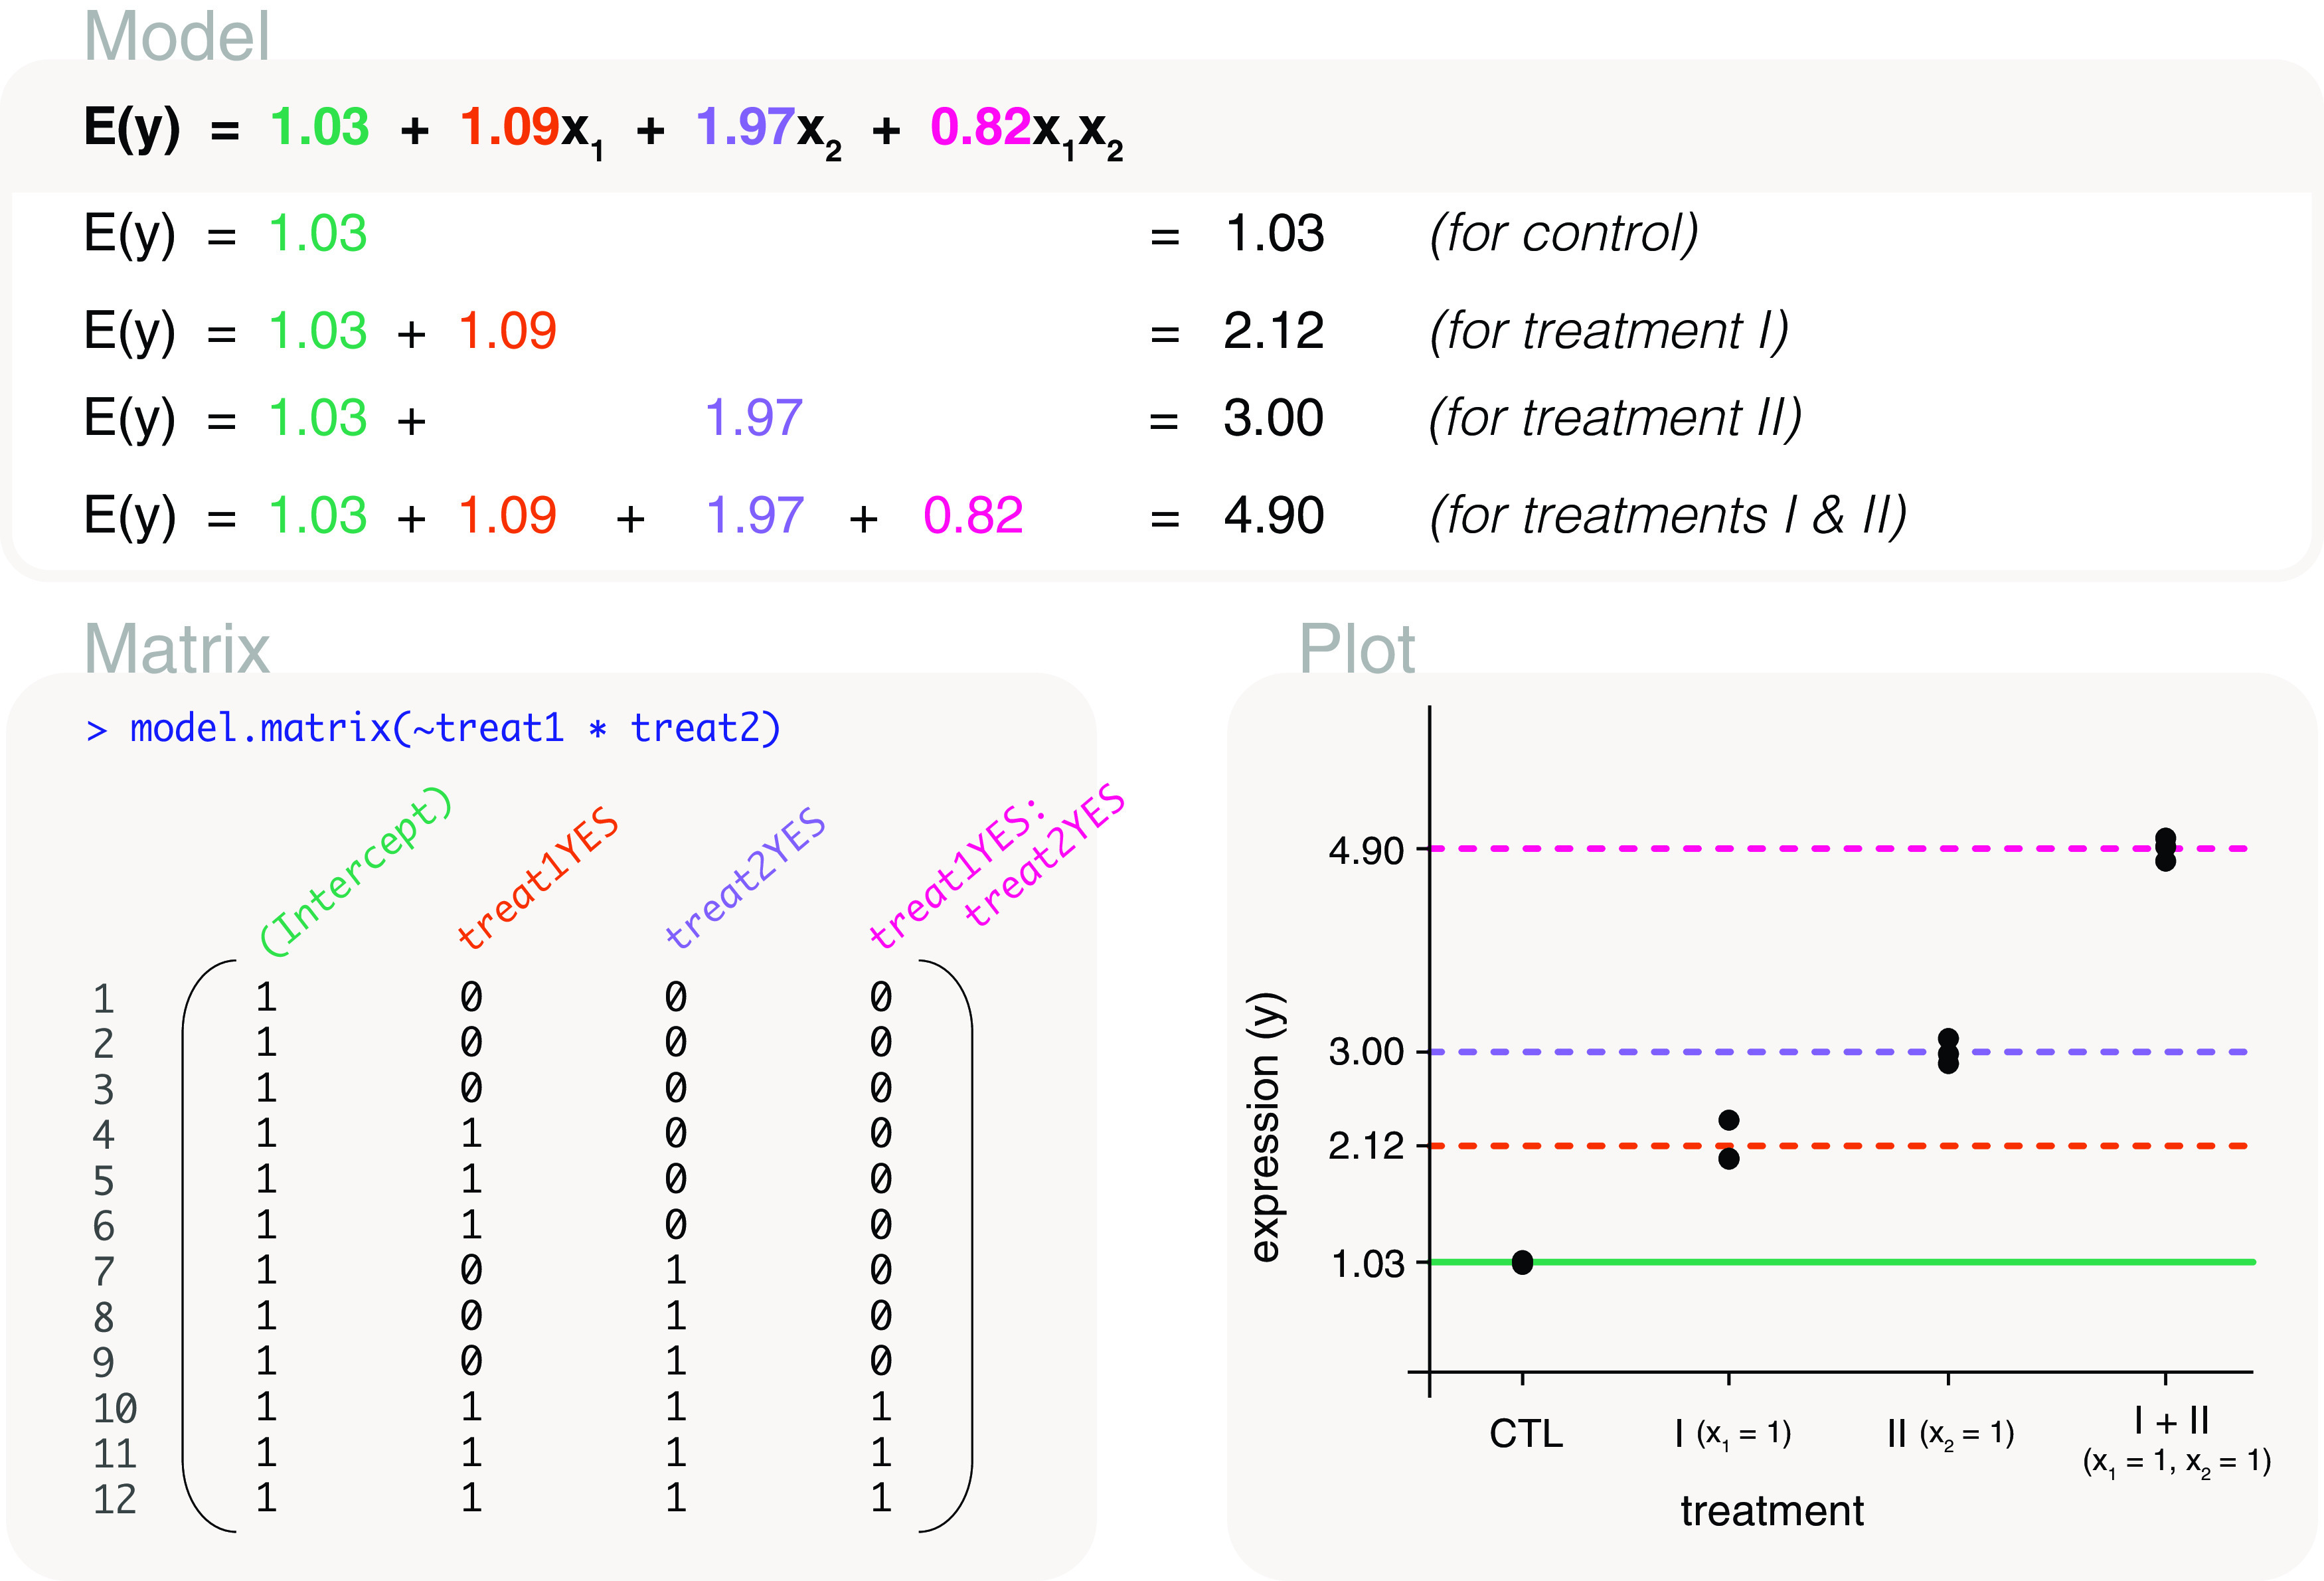
Figure 9. Expected gene expression is modelled by a two factors representing treatment I and treatment II.

The design matrix that is used includes an interaction term in the last column, and we refer to the associated model as an interaction model. The interaction term can be used to indicates whether the combined administration of treatments I and II have an additive effect (interaction term equal to zero), have a synergistic effect (interaction term has a positive value), or have a repressive effect (interaction term has a negative value). In this example, the interactive effect is estimated as 0.82. The x’s in the model are indicator variables for treatment I and treatment II, where x 1 x 2 is only equal to 1 if both treatments are present.
