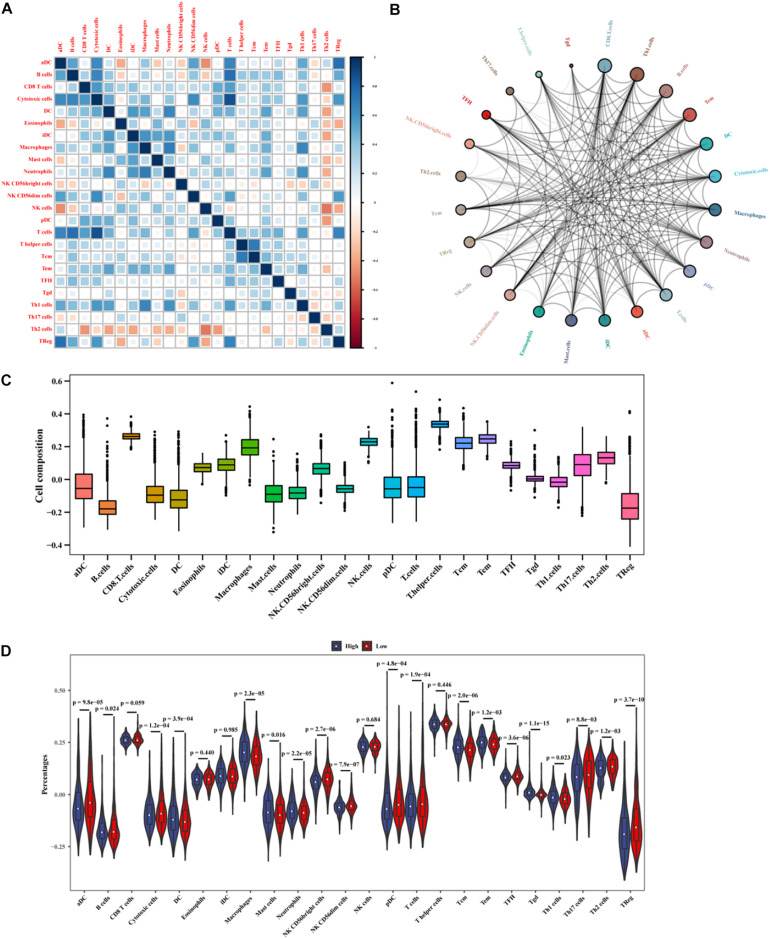
FIGURE 11.
Analysis of immune cell infiltration in BC patients. (A) The correlation between infiltrating immune cells. (B) The cycle indicates the immune cell-cell interactions in the tumor microenvironment in BC. A larger circle corresponds to more interactions between immune cells and vice versa. (C) The x-axis represents immune cell types, and the y-axis represents the percentage of immune cells. (D) The differences in the expressions of infiltrating immune cells between the high- and low-risk groups.

