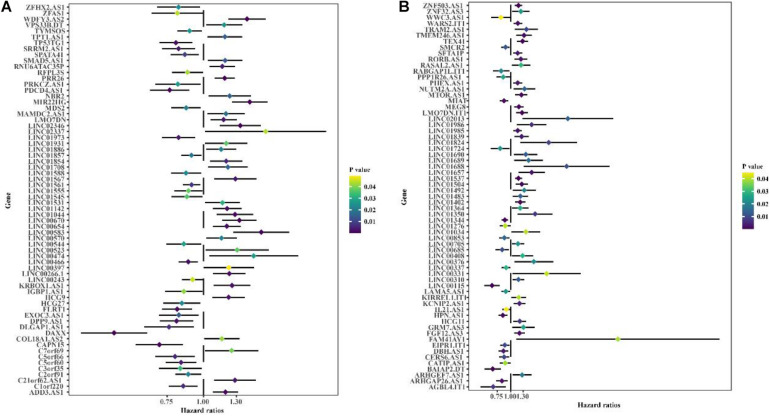
FIGURE 2.
Univariate Cox regression is used to identify the forest graph of 166 immune-associated lncRNAs related to prognosis. (A) Part A of 166 immune-associated lncRNAs. (B) Part B of 166 immune-associated lncRNAs. The yellower the color is, the higher the p value; the bluer the color is, the smaller the p value.

