FIGURE 4.
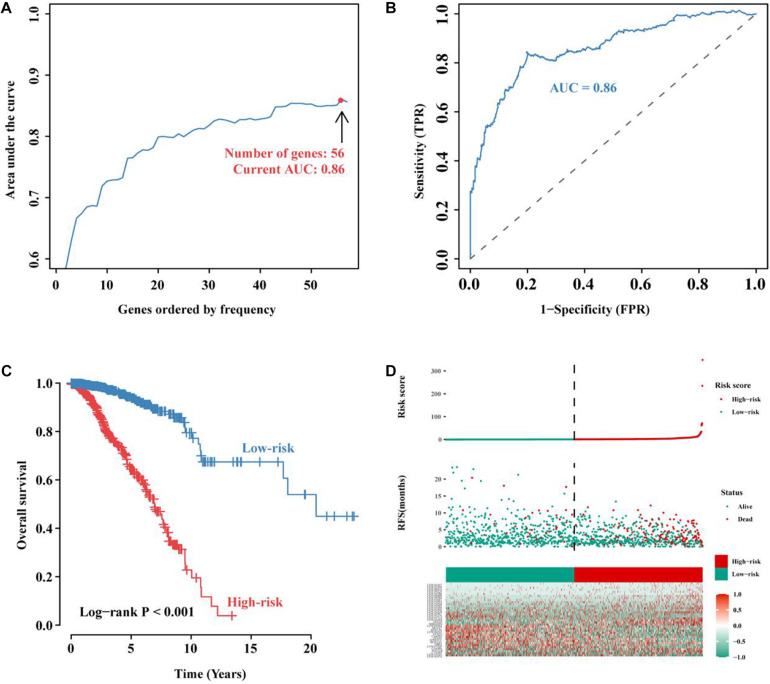
Construction and evaluation of the immune-related 56-lncRNA signature. (A) The immune-related lncRNA signature constructed by the iterative Lasso Cox regression analysis. (B) ROC curve used to evaluate the predictive efficiency of the signature. (C) Kaplan-Meier curve for the OS of BC patients in the high- and low-risk groups. (D) Risk-score distribution. In the x-axis, red represents higher expression levels while green represents lower expression levels. Risk scores for BC patients in the high- (red, the y-axis) and low-risk groups (green, the y-axis) were listed in ascending order.

