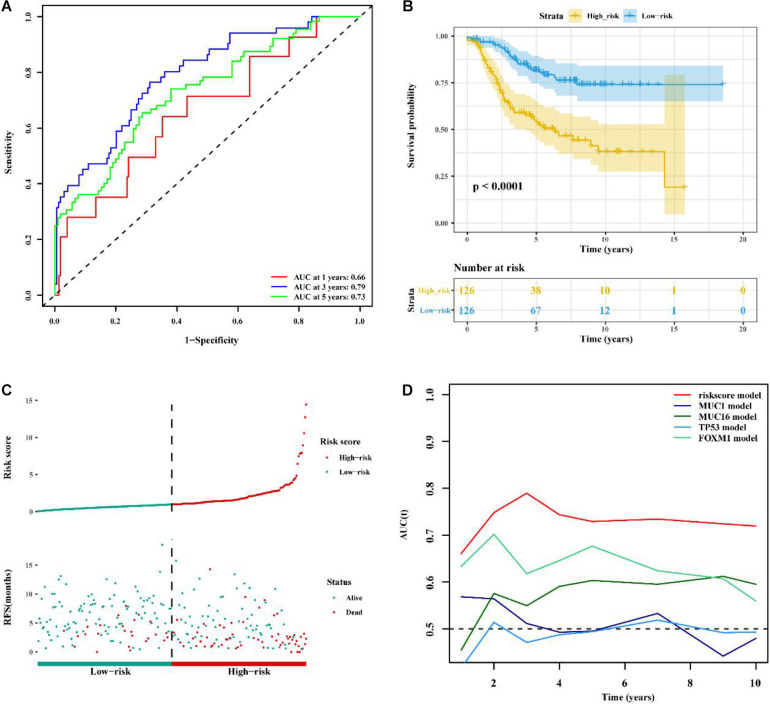
FIGURE 6.
Comparison of prognostic performances between the lncRNA signature and known prognostic biomarkers and validation using the GSE21653 cohort. (A) The ROC curve to verify the prediction efficiency of the lncRNA signature. (B) Kaplan-Meier curve for the OS of BC patients in the high- and low-risk groups. (C) The risk-score distribution and duration of RFS of the lncRNA signature in the GSE21653 validation cohort. (D) Time-dependent ROC curve to compare prediction efficiency between the lncRNA signature and the known prognostic biomarkers.

