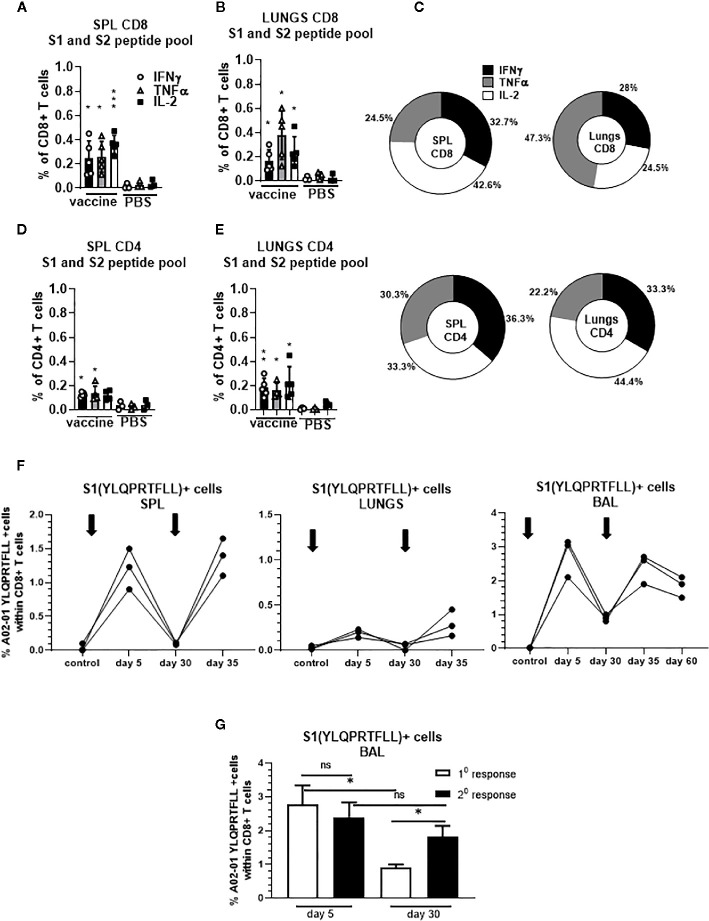
Figure 5.
Secreted gp96-Ig-S vaccine induces protein S specific memory CD8+ and CD4+ T cells in the spleen and lungs. Thirty days after the vaccination of HLA-A2.1 transgenic mice, splenocytes and lung cells were isolated from vaccinated and control mice (PBS) and in vitro restimulated with S1 and S2 overlapping peptides from SARS-CoV-2 protein in the presence of protein transport inhibitor, brefeldin A for the last 5 h of culture. After 20 h of culture, ICS was performed to quantify protein S-specific CD8+ and CD4+ T-cell responses. Cytokine expression in the presence of no peptides was considered background and it was subtracted from the responses measured from peptide pool stimulated samples for each individual mouse. (A, B) CD8+ T cells from spleen and lungs expressing IFNγ, TNFα, and IL-2 in response to S1 and S2 peptide pool; (D, E) CD4+ T cells from spleen and lungs expressing IFNγ, TNFα, and IL-2 in response to S1 and S2 peptide pool; (C) Proportion of antigen (protein S)-experienced CD8+ and CD4+ T cells isolated from spleen and lung tissue expressing IFNγ, TNFα, or IL-2 after o/n stimulation with S1 + S2 peptides. Pie charts corresponding to cytokine profiles of CD8+ and CD4+ T cells isolated from spleen and lung tissue; (F) 5 days after primary and secondary vaccination of HLA-A2.1 transgenic mice, splenocytes, lung cells and BAL were isolated form vaccinated and control mice (PBS). Time of primary and secondary vaccination is indicated with black arrows. Cells were stained with HLA-A2 pentamer containing YLQPRTFLL peptide, followed by surface staining for CD45, CD3, CD4, CD8. (G) BAL was analyzed 5 and 30 days after primary and secondary vaccination and frequency of HLA-A2 pentamer positive cells was determined. Graphs represent percentage of the pentamer positive cells within CD8+ T cells in individual mice; Data represent at least two technical replicates with three to six independent biologic replicates per group. *p<0.05, **p<0.01, ***p<0.001, ns, not significant. Kruskal-Wallis ANOVA with Dunn’s multiple comparisons tests were applied. Asterisks (*) above or inside the column denote significant differences between indicated T cells producing cytokines in vaccine versus control (PBS) at 0.05 alpha level. ANOVA, analysis of variance; ICS, intracellular cytokine staining; IFN, interferon; IL, interleukin; PBS, phosphate-buffered saline; TNF, tumor necrosis factor.

