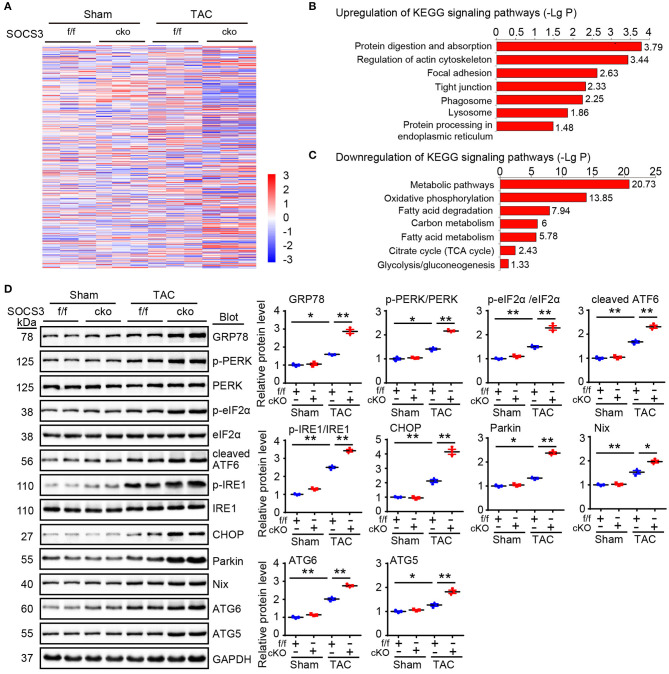
Figure 4.
Proteomic analysis of heart tissues. (A) WT (SOCS3f/f) and cardiomyocyte-specific SOCS3 knockout mice (SOCS3cko) were subjected to Sham or TAC operation for 4 weeks. Proteomic analysis was performed using an iTRAQ-based strategy. The heat map of the protein expression differences from the proteomics between SOCS3f/f and SOCS3cko mice. The red color indicates upregulation and blue is for downregulation. (B,C) Analysis of Kyoto Encyclopedia of Genes and Genomes pathway enrichment for differentially expressed proteins in heart tissues. LgP represents the logarithm of P-value. (D) Immunoblotting analysis of GRP78, p-PERK, PERK, p-eIF2α, eIF2α, cleaved ATF6, p-IRE1, IRE1, CHOP, Parkin, Nix, ATG6, and ATG5 protein levels in hearts, and quantification (n = 3). GAPDH was used as an internal control. Data are presented as mean ± SEM, and n represents the number of animals per group. *P < 0.05, **P < 0.01.

