Fig. 1.
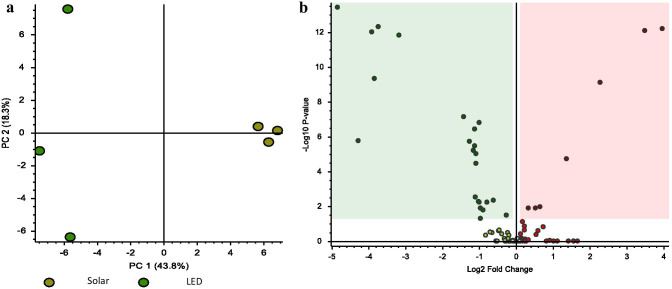
Multivariate statistical analyses. The principal component analysis (PCA) score plots of the Solar and LED Spirulina extracts (a). Differential analysis that presents all the difference of the metabolite profile between Solar and LED Spirulina extracts (b). Dots in red are the upregulated compounds in the LED extract compared with Solar extract. Dots in green are the downregulated compounds in the LED extract compared with Solar extract. Squared metabolites are significantly increased (red) or decreased (green) at the LED extract compared with Solar extract with P value < 0.05 using t test statistical analysis

