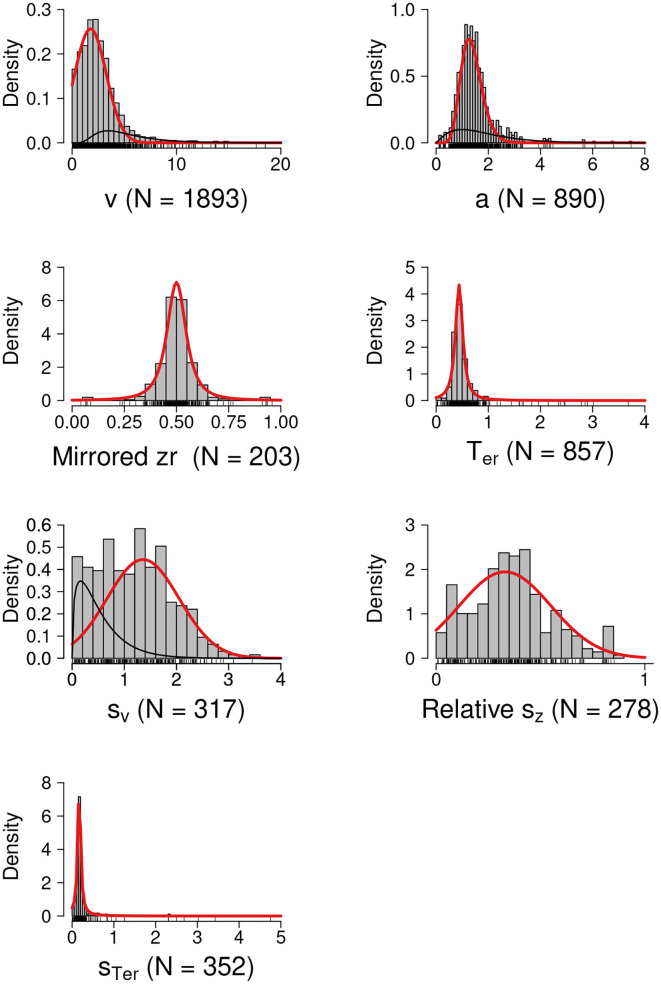
Figure 3.
Prior Distributions for the DDM Parameters. The red lines show the best fitting theoretical distributions or the dominant theoretical distribution components with the highest mixture weight (i.e., the proposed informative prior distributions). The black lines show the non-dominant distribution components. N, number of unique estimates.

