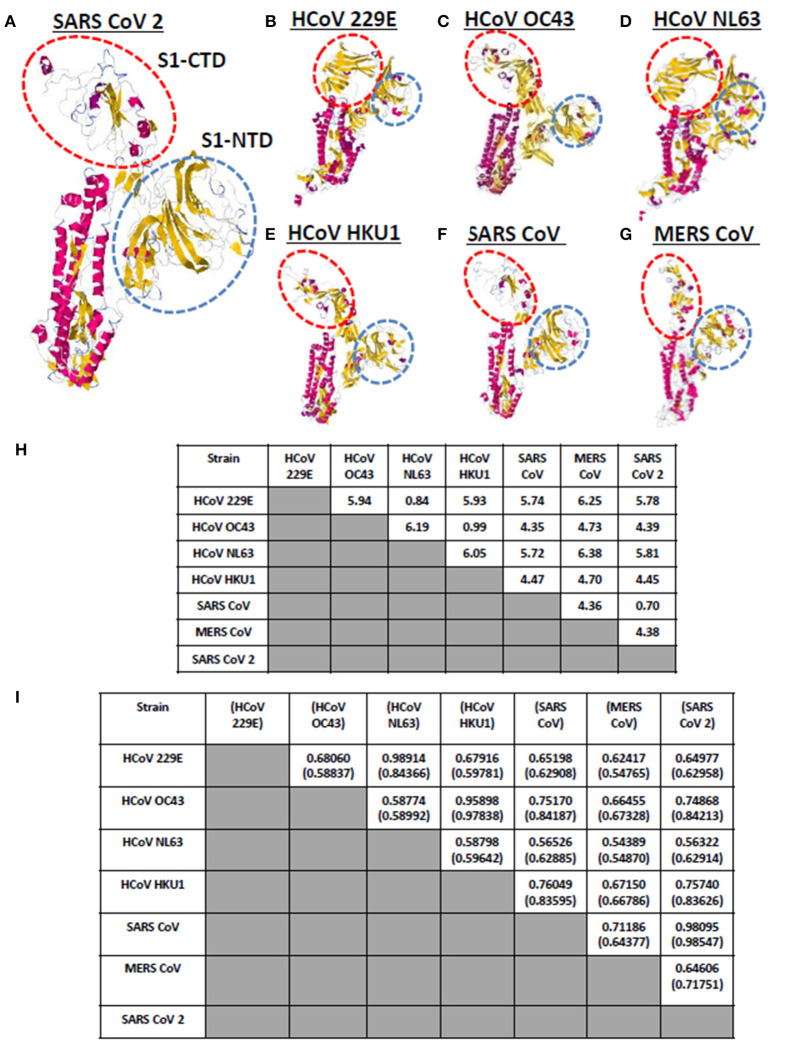
Figure 2.
Whole protein structural comparison of the various monomeric human-infecting coronavirus spike protein models. Representative spike protein models of (A) SARS CoV 2, (B) HCoV 229E, (C) HCoV OC43, (D) HCoV NL63, (E) HCoV HKU1, (F) SARS CoV 1, and (G) MERS CoV are shown. S1-CTD (red dashed circle) and S1-NTD (blue dashed circle) are indicated. (H) RMSD and (I) Tm scores of superimposed spike models are tabulated. Tm scores normalized to a spike model is distinguished by having or not having a parenthesis.

