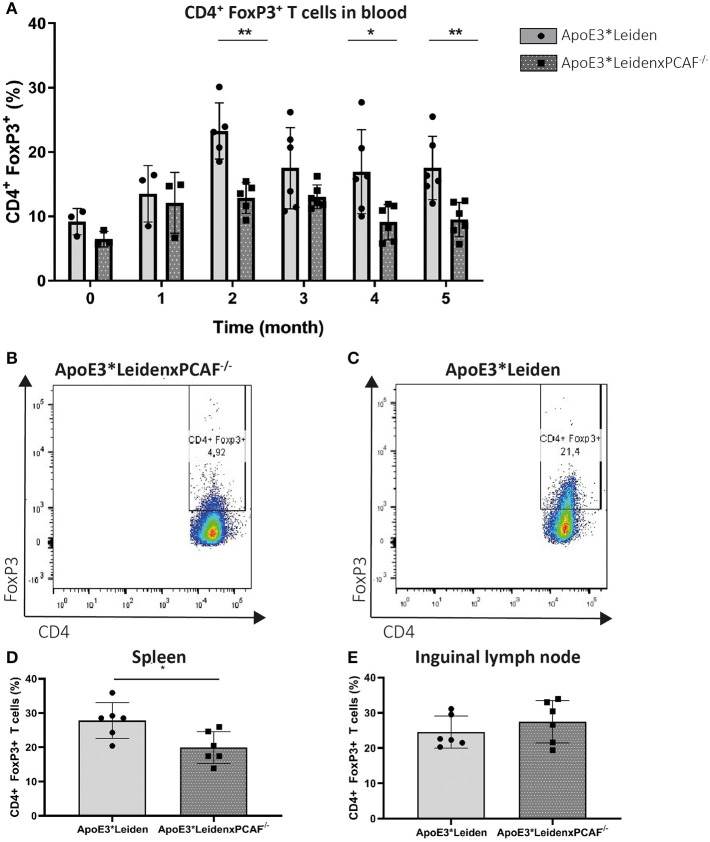
Figure 2.
FoxP3 expression in time measured by flow cytometry in PBMC of ApoE3*Leiden and ApoE3*LeidenxPCAF−/− mice. Peripheral blood mononuclear cells from ApoE3*Leiden and ApoE3*LeidenxPCAF−/− mice (for both groups; n = 3 for timepoint 0 (before high-fat diet) and one month, n = 6 for the time points 2–5 months) were analyzed by flow cytometry. The percentage CD3+ CD4+ FoxP3+ cells in the PBMCs isolated from ApoE3*Leiden mice and ApoE3*LeidenxPCAF−/− mice (A). CD4+ FoxP3+ dot plot of PBMCs from an ApoE3*LeidenxPCAF−/− mouse (B) and an CD4+ FoxP3+ dot plot of PBMCs from ApoE3*Leiden mouse (C) after 5-months of HFD. The percentage CD4+ FoxP3+ T cells in splenocytes (D) and inguinal lymph nodes (E) after 5-months of HFD. Non-parametric T-test *P < 0.05, **P < 0.01, and ***P < 0.001.

