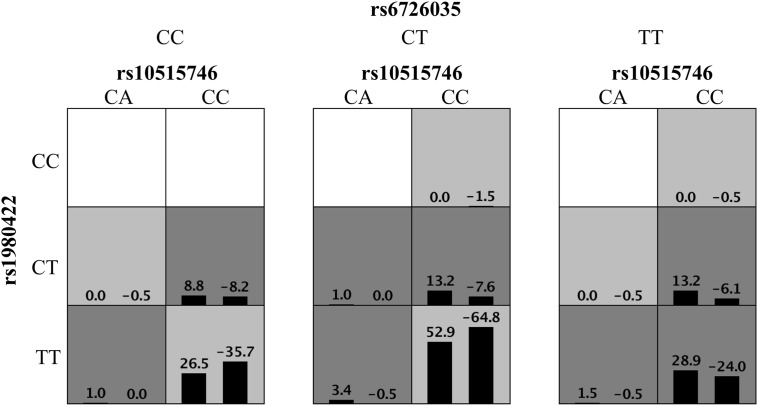
Figure 1.
Distribution of high-risk genotypes and protective genotypes in the GMDR model. High risk genotypes (dark gray) and protective genotypes (light gray) combinations are presented. Patterns of high-risk genotypes and protective genotypes differ across different multi-locus dimensions; this is evidence of epistasis or gene–gene interaction.

