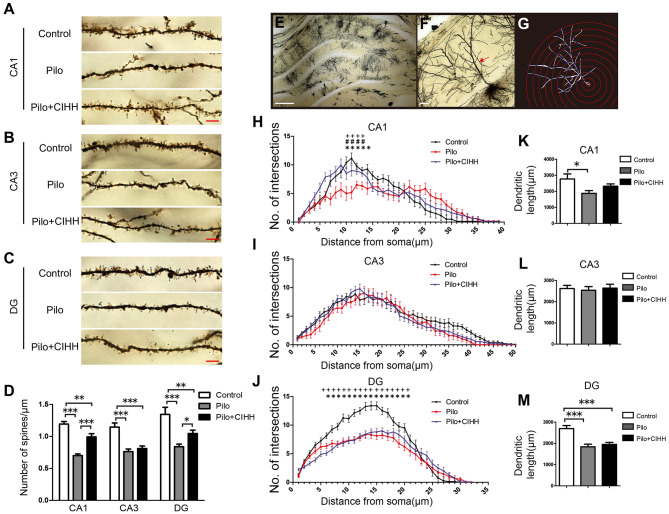
Figure 2.
CIHH increases dendritic spine density and dendritic complexity in the hippocampus of epileptic rats. Golgi staining was used to reveal dendritic spines from secondary and tertiary apical dendrites in the CA1 (A), CA3 (B), and DG (C) regions of the hippocampus as summarized in (D). (E) Image of the hippocampus showing a single Golgi-impregnated neuron. (F) Apical dendrites (red arrow). (G) Concentric circles used for Sholl analysis. (H–J) Mean numbers of apical dendritic intersections in the CA1 (H), CA3 (I), and DG (J) regions of the hippocampus as assessed by Sholl analysis. Pilo vs. Control, *P < 0.05; Pilo + CIHH vs. Control, +P < 0.05; Pilo + CIHH vs. Pilo, #P < 0.05 by repeated-measures ANOVA. (K–M) Graphs showing total apical dendritic length (μm) in the CA1, CA3, and DG regions of the hippocampus. *P < 0.05, **P < 0.01, ***P < 0.001 by one-way ANOVA. All values are presented as the mean ± SEM. n = 3 rats/group. (A–C) Scale bar, 5 μm. (E) Scale bar, 200 μm. (F) Scale bar, 20 μm.

