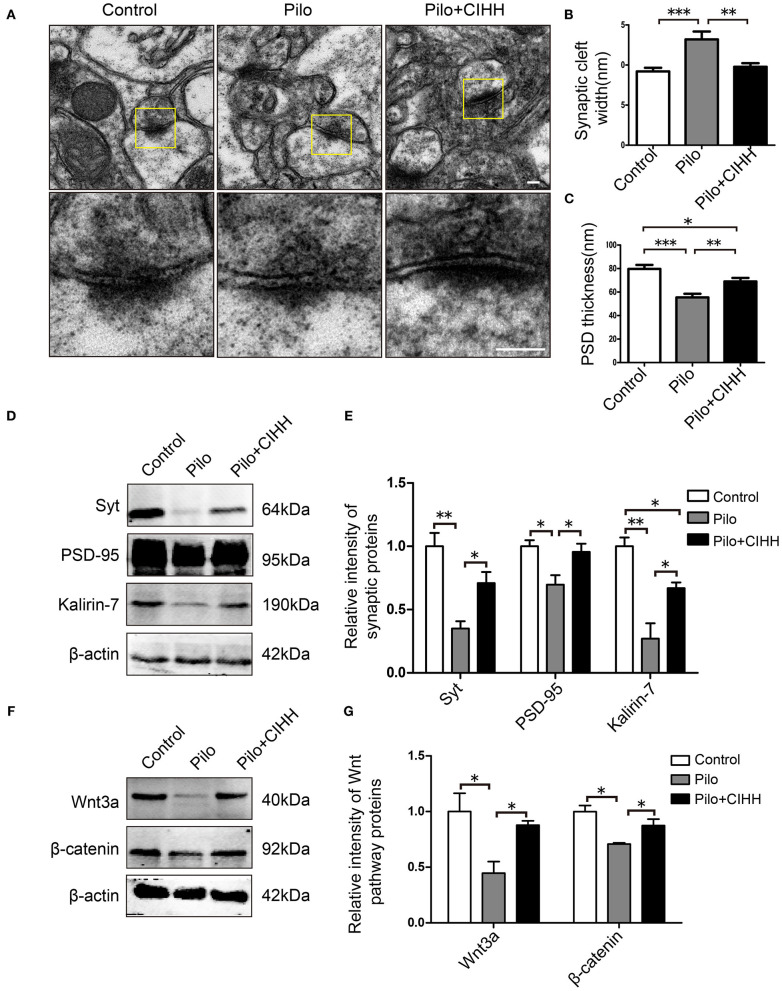
Figure 3.
Effects of CIHH on synaptic ultrastructure in the CA1 and plasticity-related protein expression in the hippocampus. (A) Scanning electron microscope images showing synaptic ultrastructure. Synaptic cleft width (B) and PSD thickness (C) in each group. (D,E) Western blots of Syt, PSD-95, and kalirin-7 expression in the hippocampus. (F,G) Western blots of Wnt3a and β-catenin expression in the hippocampus. All values are normalized to the control samples. All values are presented as the mean ± SEM (*P < 0.05, **P < 0.01, ***P < 0.001 by one-way ANOVA). n = 3 rats per group. (A) Scale bar, 100 nm.

