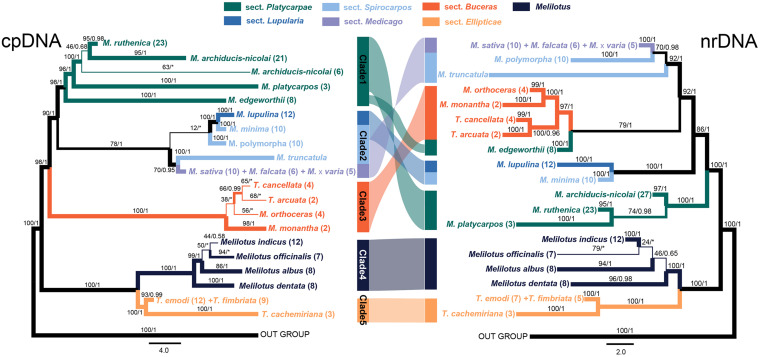
FIGURE 2.
Phylogenetic trees of the three genera, Medicago, Trigonella, and Melilotus reconstructed based on two cpDNA barcodes (left) and two nuclear markers (right). Colors represent Melilotus and different sections of Medicago and Trigonella. Maximum likelihood (ML) bootstrap values and Bayesian posterior probabilities are indicated. The thickest branches indicate high support from the ML and BI analyses (bootstrap values ≥80 and posterior probabilities ≥0.95), thinner branches indicate high support from one of the two analyses, and the thinnest branches indicate low support from both analyses. The congruence and incongruence between the two trees are represented by color-shaded connections. The two inverted connections indicate significantly incongruence interspecific-relationships within each clade.

