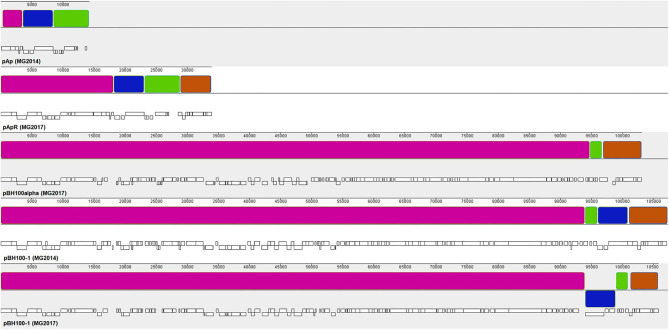
Figure 1.
Synteny analysis between the plasmids of E. coli BH100 sub-strains. Blocks of the same colors represent homologous nucleotide matches between the plasmids pAp (BH100 MG2014), pApR (BH100 MG2017), pBH100alpha (BH100L MG2017), pBH100 (BH100 MG2017), and pBH100-1 (BH100 MG2014). White bars below each sequence represent the position of CDS. A rearrangement between pApR and pBH100-1 (BH100 MG2017) is indicated by the homologous segments in pink and orange. Other homologous segments in pAp (green and blue blocks) are also found in the plasmids pBH100-1 (BH100 MG2014) and pBH100-1 (BH100 MG2017) suggesting other recombination events. The blue block displayed below the line in pBH100-1 (BH100 MG2017) indicates a genomic inversion at the recombined region. To achieve a better visualization, the original sequences of pAp and pBH100alpha were split in a different genomic position. For the same purpose, the reverse complement sequence of pApR assembly was used and split in a different genomic position.

