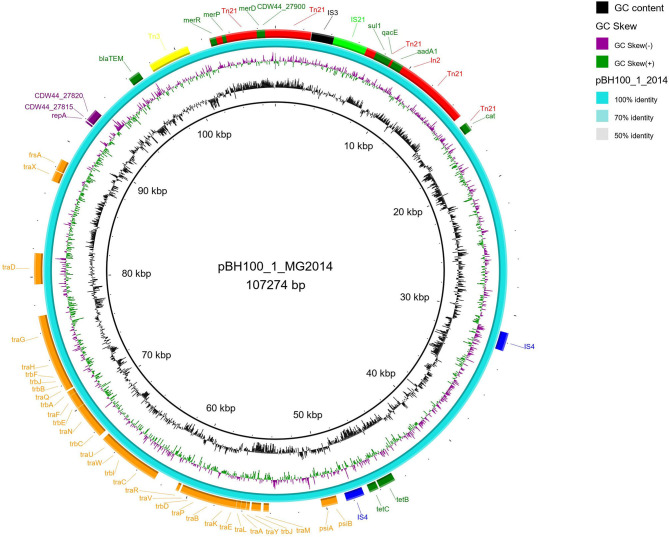
Figure 3.
Schematic representation of pBH100-1 from E. coli BH100 MG2014. The position of the main genes and features involved in mobilization of MDR in pBH100-1 are represented in the illustration generated in BRIG. The orange and purple bars represent genes involved in the conjugation and replication process, respectively. Antibiotic resistance genes are represented in dark green bars. The IS elements and other transposases, predicted by the ISfinder tool, are indicated by bars in light green (IS21), black (IS3), blue (IS4), yellow (Tn3), and red (Tn21).

