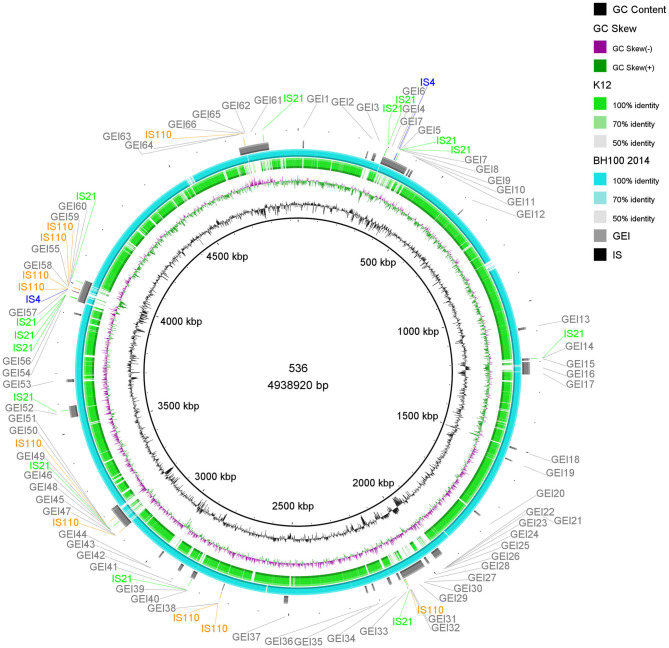
Figure 6.
Distribution of IS elements and GEI on E. coli 536. An alignment (70–100% identity) between the genomic sequences of E. coli 536 and the strains BH100 MG2014 and K12, performed in BRIG, is represented by the rings in light blue and green colors. GEI identified via IslandViewer4 in E. coli 536 are indicated by the gray bars. The IS elements, predicted by the ISfinder tool, are indicated by arrows in green (IS21), blue (IS4), and orange (IS110). GC content is represented by the inner ring in black.

