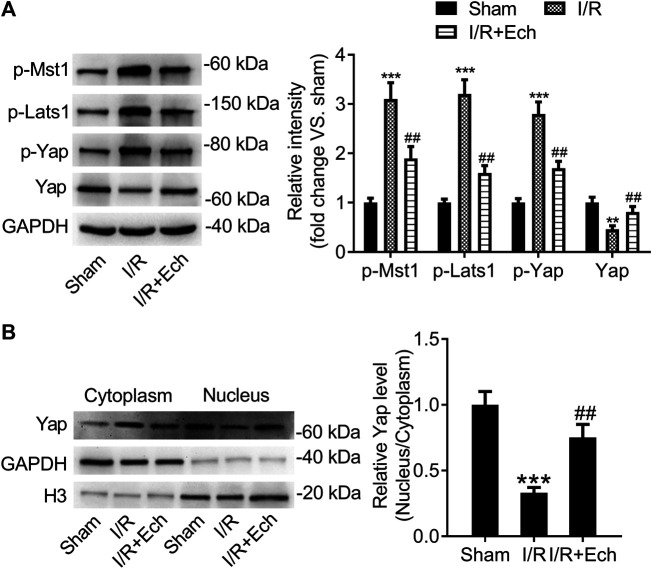
FIGURE 3.
Ech inhibits the Hippo/YAP signaling pathway in vivo. (A) Representative images of western blot analysis and quantification of p-MST1, p-LATS1, p-YAP, and YAP expression in the cardiac tissues of MI/R rats (n = 4). (B) Representative images of western blot analysis and quantification of cytoplasmic and nuclear YAP expression in the cardiac tissues of MI/R rats (n = 4). **p < 0.01 and ***p < 0.001 compared with the sham group; ## p < 0.01 compared with MI/R rats.

